

The Fed probably won’t change rates — but its words could swing the S&P 500 by 1% to 3% within an hour.
Markets are pricing a hold, with futures showing about 65% odds of no change and 35% for a 25 bps hike.
What matters most is the statement and the dot plot: “higher for longer” hits growth and tech, while “patient” or a dovish tilt usually sparks relief rallies.
This piece lays out likely market reactions, sector winners and losers, and the key indicators to watch.
Immediate Expectations for the Upcoming Fed Meeting and Stock Market Impact

Markets are pricing a hold right now. The fed funds target should stay between 3.50% and 3.75%. Fed-funds futures put the odds at roughly 65% for no change at the next meeting, with a smaller 35% shot at a 25-basis-point hike if inflation numbers come in hot before decision day. That shift away from earlier cut expectations? It’s all about persistent core PCE readings above the Fed’s 2.0% target and jobs data that keeps coming in stronger than expected.
Here’s the thing. How the market moves depends way less on the rate decision itself and way more on the language the Fed uses to describe what’s next. Phrases like “higher for longer” usually spark immediate selloffs in equities, especially rate-sensitive growth stocks, because they reset expectations for how long borrowing costs stay elevated. But when you hear terms like “data-dependent,” “patient,” or “soft landing,” investors often interpret those as signals that the tightening cycle is wrapping up. Relief rallies follow. The gap between hawkish and dovish framing can swing the S&P 500 by 1% to 3% within the first hour after the statement drops around 2:00 PM Eastern.
Fed communication matters because it shapes the discount rate investors apply to future earnings. When the Fed signals that rates will stay high into 2024, valuations compress across equity markets. Long-duration assets get hit hardest because their cash flows are years away. Markets also watch for any change in the dot plot, which is the Fed’s projected path for rates. Upward revisions in the median forecast for 2024 or 2025 immediately reprice equity risk premiums.
Most likely stock market reactions in the first 24 hours:
- Rate hold with neutral language: S&P 500 flat to up 0.5%, modest rally in growth and tech, volatility drops quickly.
- Rate hold with hawkish tone (“higher for longer”): S&P 500 down 1% to 2%, financials outperform, tech and consumer discretionary lag.
- 25 bps hike with guidance for pause: initial 1% to 2% dip followed by recovery if the Fed signals this is the final move.
- 25 bps hike with more hikes signaled: S&P 500 down 2% to 4%, VIX spikes above 25, defensive rotation into utilities and staples.
- Surprise dovish shift (cuts mentioned): S&P 500 up 2% to 5%, growth stocks surge, REITs and long-duration bonds rally hard.
How Stocks Have Historically Reacted to Similar Fed Decisions

History shows that equity markets tend to sell off during the initial phase of rate-hike cycles and rally once the Fed pauses or pivots toward cuts. During the 2022 tightening cycle, the S&P 500 fell roughly 19.4% for the year as the Fed delivered cumulative hikes of about 425 basis points from March through December. The steepest single-day moves, often 2% to 3%, happened when the Fed surprised markets with larger than expected hikes or when Chair Powell’s press conference remarks came in more hawkish than the statement suggested. When the Fed paused in early 2019 after a series of hikes in 2018, the S&P 500 rallied approximately 13% over the next three months as recession fears eased.
Rate cuts usually produce immediate positive reactions, but context matters. Emergency cuts during crises, like March 2020’s 150 basis points of cuts, initially failed to halt equity declines because they signaled severe economic distress. The S&P 500 fell another 12% in the two weeks following those cuts before bottoming. Preemptive or “insurance” cuts in mid-expansion environments, like the three quarter-point cuts in 2019, tend to support equity gains because they extend the business cycle without confirming recession. The first 24 hours after a dovish surprise can deliver 1% to 3% gains, with continued strength over the next week if follow-through commentary stays supportive.
| Policy Decision | Average 1-Day Market Move | Average 1-Week Move | Notable Example |
|---|---|---|---|
| 25 bps hike (expected) | -0.2% to +0.5% | -0.5% to +1.0% | March 2022: S&P 500 +2.2% on rate hike clarity |
| 50–75 bps hike (surprise) | -1.5% to -3.0% | -2.0% to -5.0% | June 2022: 75 bps hike, S&P 500 -3.3% week |
| Rate hold (hawkish tone) | -0.8% to -2.0% | -1.5% to -3.5% | September 2023: pause + higher-for-longer messaging |
| Rate cut (preemptive/insurance) | +1.0% to +2.5% | +2.0% to +4.0% | July 2019: 25 bps cut, S&P 500 +3.1% week |
Sector-Specific Impacts of Fed Policy
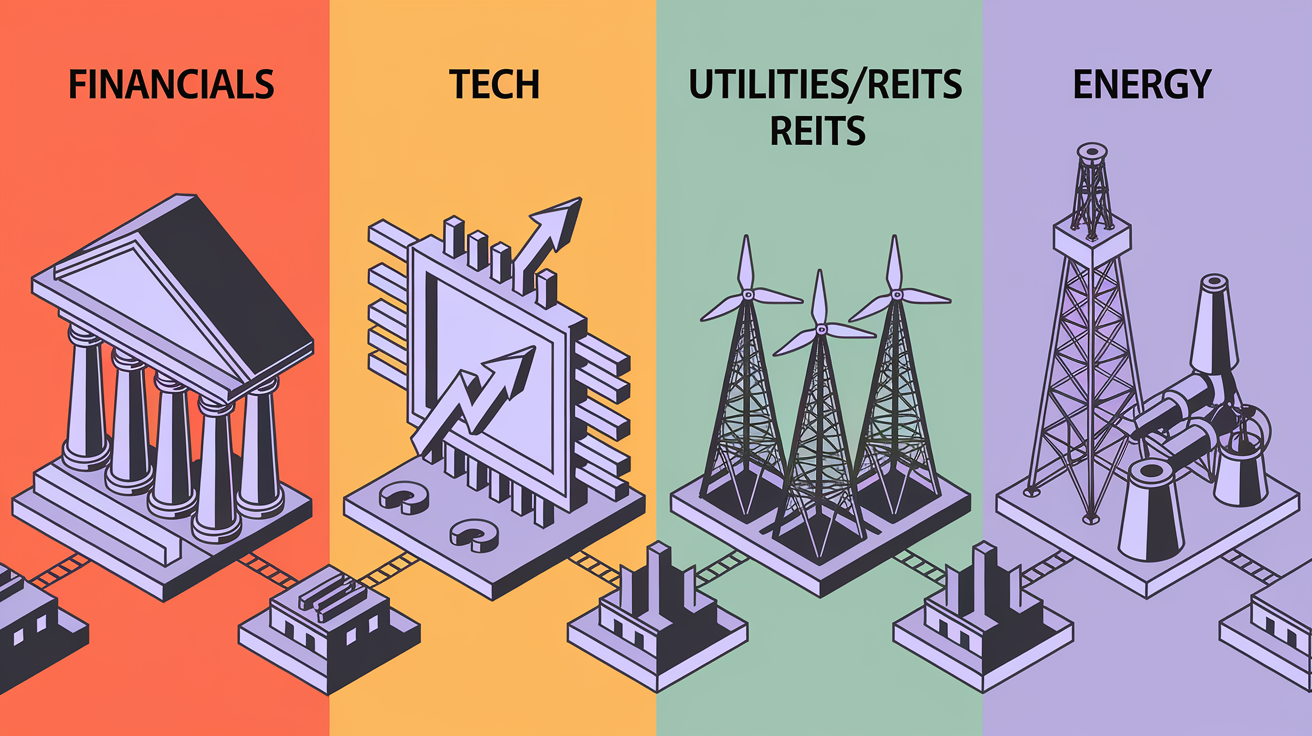
Financials, particularly banks and regional lenders, usually benefit early in a rising-rate cycle because short-term rate increases widen net interest margins. When the Fed raises the fed funds rate by 25 or 50 basis points, banks can immediately reprice short-duration loans and deposits, capturing the spread between what they pay depositors and what they earn on loans. This drove bank stocks higher during the first half of 2022 even as broader markets sold off. But if the Fed overtightens and pushes the economy toward recession, credit quality deteriorates and loan-loss provisions rise, which can reverse early gains. Consider a modest overweight to financials, up to 5% to 10% above benchmark, if the Fed signals gradual, predictable hikes with stable growth.
Technology and long-duration growth stocks face the opposite pressure. Higher discount rates compress the present value of distant future cash flows, hitting unprofitable or high-multiple names hardest. A 100-basis-point rise in the 10-year Treasury yield can reduce fair-value estimates for high-growth tech by 10% to 20% depending on the duration of expected earnings. During 2022, the Nasdaq Composite fell roughly 33% peak to trough as yields surged from about 1.5% to over 4.0%. If the Fed maintains or raises rates, trimming tech exposure by 5% to 15% and rotating into cash-generative, lower-multiple names can help manage downside risk.
Utilities, REITs, and telecom stocks behave like long-duration bonds. They offer steady dividends but suffer when Treasury yields rise because investors can earn comparable income with less equity risk in fixed-income markets. REITs are doubly sensitive. Higher rates increase their borrowing costs for property acquisitions and refinancing, and higher cap rates reduce property valuations. Expect these sectors to underperform by 3% to 8% in the months following hawkish Fed pivots. Energy and industrials can outperform if the Fed’s tightening is gradual and economic growth stays positive, because demand for commodities and capital goods holds up even as rates rise.
Sector performance summary under different Fed scenarios:
- Hike cycle starts or accelerates: Financials outperform, tech and REITs lag, energy and materials can hold up if growth stays positive.
- “Higher for longer” message: Value and dividend-paying stocks with pricing power outperform, high-multiple growth underperforms, utilities and REITs face headwinds.
- Pause or dovish pivot: Growth and tech surge, small caps rally, REITs and utilities rebound, financials may give back gains.
- Rate cuts begin: Broad rally led by rate-sensitive sectors like tech, REITs, consumer discretionary. Financials may underperform if cuts signal economic weakness.
- Aggressive cuts (emergency): Flight to quality. Defensive staples and healthcare outperform, cyclicals and banks initially sell off.
- Gradual cuts (soft landing): Most sectors participate, growth and cyclicals lead, energy may lag if demand concerns emerge.
Economic Indicators the Fed Is Watching
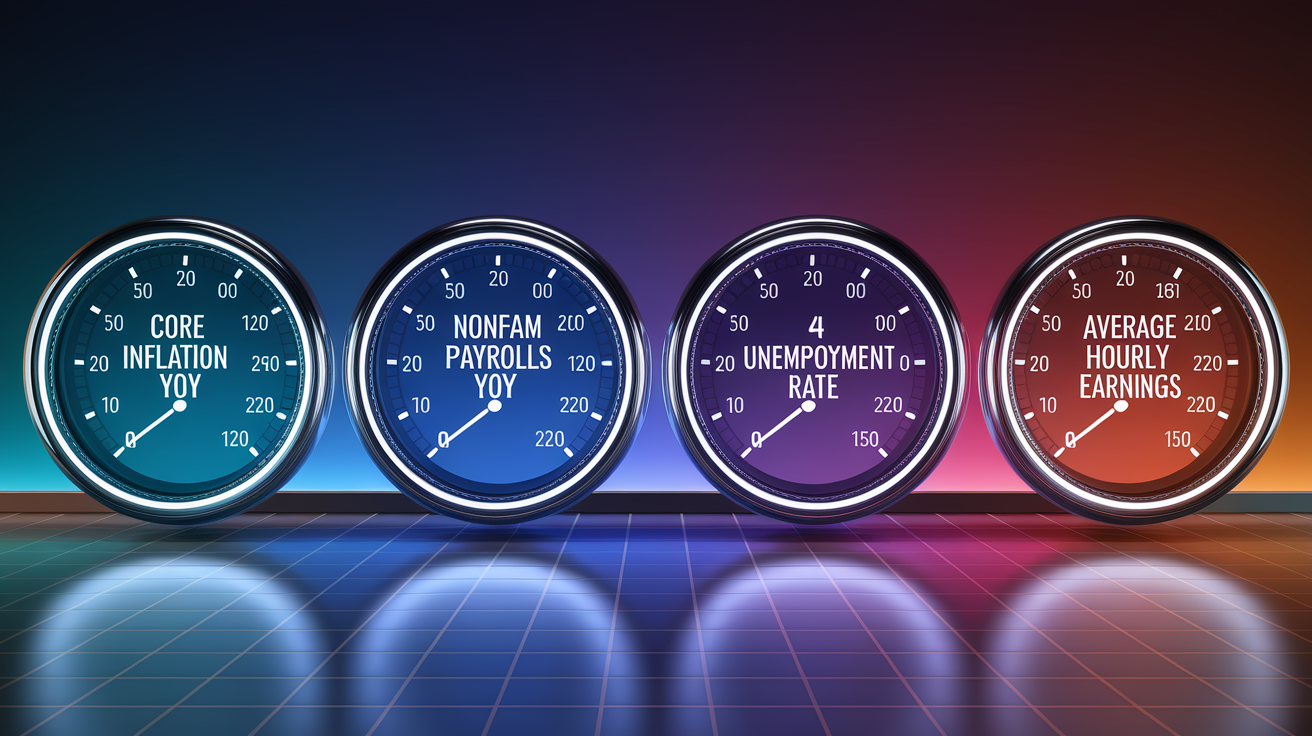
The Federal Reserve anchors its policy decisions on a narrow set of high-frequency economic indicators that directly measure inflation and labor-market health. Core Personal Consumption Expenditures, or core PCE, is the Fed’s preferred inflation gauge. It’s the single most important number. The Fed targets 2.0% year over year core PCE. Sustained readings above 2.5% materially increase the odds of further tightening, while prints consistently at or below 2.0% open the door to rate cuts. Recent core PCE has hovered in the 2.5% to 3.0% range, keeping policymakers cautious. Month-to-month changes matter as much as year-over-year figures because they reveal whether disinflation is accelerating or stalling.
The labor market provides the second pillar of Fed analysis. Nonfarm payrolls and the unemployment rate shape the Fed’s view on whether the economy can tolerate higher rates without tipping into recession. Payroll gains above 200,000 per month and unemployment below 4.0% signal a tight labor market that can generate wage-driven inflation, prompting hawkish policy. A rise in unemployment of 0.5 to 1.0 percentage points or payrolls falling below 100,000 would likely shift the Fed toward cuts. Wage growth, measured by average hourly earnings, also matters. Consistent monthly gains above 0.4% can sustain services inflation even if goods prices cool.
Four key indicators the Fed weighs most heavily:
- Core PCE inflation (monthly and year over year): Persistent readings above 2.5% YoY means higher for longer. Sustained at or below 2.0% means cuts become possible.
- Nonfarm payrolls and unemployment rate: Strong job gains over 200k per month plus low unemployment below 4.0% equals hawkish tilt. Sharp slowdown or unemployment rise equals dovish shift.
- Average hourly earnings (wage growth): Monthly gains consistently above 0.4% suggest sticky services inflation. Moderation below 0.3% supports disinflation narrative.
- GDP growth and revisions: Sequential quarterly GDP below 1.0% annualized raises recession risk and lowers hike probability. Strong growth above 2.5% supports higher rates without immediate damage.
Expert Forecasts and Market Expectations

The consensus among economists and strategists heading into the upcoming Fed meeting leans toward a policy hold with cautious forward guidance. Most major Wall Street forecasters expect the Fed to keep rates steady in the 3.50% to 3.75% range while emphasizing that future moves remain “data-dependent.” This reflects recent inflation data showing core PCE decelerating modestly but still above the Fed’s 2.0% target, combined with labor-market resilience that gives policymakers room to wait. Economists agree that the Fed will avoid declaring victory over inflation prematurely. They’d rather hold rates higher for an extended period than risk a resurgence in price pressures.
Futures markets offer a real-time probability-weighted view of policy outcomes. As of the latest pricing, fed-funds futures imply roughly 65% odds of no change at the next meeting, 30% odds of a 25-basis-point hike if inflation data surprises higher, and less than 5% odds of a cut. The futures curve for six to twelve months out shows modest expectations for eventual easing, perhaps one or two 25-basis-point cuts by year-end, but only if core inflation convincingly trends toward 2.0%. This pricing represents a big shift from earlier in the year when markets anticipated multiple rate cuts. That repricing added volatility and pushed equity valuations lower.
Commentary from large institutional research desks echoes the themes of caution and conditionality. Investment banks and asset managers are telling clients to prepare for a “higher for longer” environment where the Fed prioritizes credibility over short-term growth support. Several institutions have raised their year-end fed-funds forecasts and pushed out expected cut timelines into 2024 or beyond. The common thread? The Fed will move slowly and signal clearly, avoiding abrupt pivots that could destabilize markets or undermine confidence in its inflation-fighting resolve.
Timing of the Fed Announcement and What to Watch

The Federal Open Market Committee usually releases its policy statement at approximately 2:00 PM Eastern Time on the final day of its two-day meeting. This statement includes the rate decision, updated language on the economic outlook, and any changes to the balance-sheet policy such as quantitative tightening caps or reinvestment plans. Roughly 30 minutes later, around 2:30 PM ET, the Fed chair holds a press conference to explain the decision, answer questions, and provide additional context that often moves markets more than the written statement itself. Equity volatility tends to spike in two waves. First at 2:00 PM when the statement hits, and again during or right after the press conference when the chair’s tone and answers to reporter questions reveal the true policy stance.
Intraday market behavior on Fed decision days follows a predictable pattern. Liquidity often thins in the hour before the announcement as traders square positions and wait for clarity. The first 15 to 60 minutes after the 2:00 PM release see the highest volatility and widest bid-ask spreads. Algorithmic and high-frequency traders dominate this window, amplifying initial moves. A second volatility surge occurs during the press conference, especially if the chair makes unexpected comments or answers questions in a way that contradicts market pricing. By the end of the trading day, markets usually settle into a clearer directional trend, but elevated volatility can persist for 24 to 72 hours as investors digest the full implications.
Three key intraday volatility triggers:
- Dot plot revisions: If the median projected rate for the next year or two shifts by 25 basis points or more, expect immediate repricing across equities, bonds, and currencies.
- Balance-sheet language changes: Any shift from “ongoing runoff” to “will begin reinvesting” or new quantitative tightening caps signals easing or tightening and moves risk assets quickly.
- Unexpected press-conference commentary: Off-script remarks about inflation risks, labor-market assessments, or future meeting intentions can reverse initial market reactions within minutes.
Practical Investing Moves Ahead of the Fed Meeting

Reducing leverage and gross exposure in the 24 to 48 hours before the Fed announcement is a common risk-management step for active traders. Margin loans and concentrated positions amplify both gains and losses during volatile periods, so trimming leverage by 50% to 100% ahead of the meeting caps downside tail risk without forcing a wholesale exit from the market. Many professional traders also tighten stop-loss levels on existing positions and avoid starting large new bets until after the policy decision and press conference have clarified the near-term outlook.
Hedging with options or inverse ETFs sized at 1% to 3% of total portfolio value can provide downside protection if the Fed surprises with a hawkish tone or unexpected hike. Short-dated put options on major indices or sector ETFs become more expensive in the days leading up to the meeting as implied volatility rises, so expect higher premiums, often 20% to 50% above normal levels. Small allocations to inverse ETFs or put spreads can limit the cost of protection while still capping losses if equities sell off sharply. These hedges are typically held only through the meeting and unwound within a few days once volatility subsides.
Longer-term investors should resist the urge to make large tactical shifts based solely on a single Fed meeting. Instead, use the announcement to reassess whether the macro regime has changed materially. For example, if the Fed pivots from pause to hike or signals imminent cuts. If the policy path stays broadly in line with prior expectations, the best course is often to rebalance back to target allocations within 30 to 90 days, taking advantage of any volatility-induced mispricings. Holding a cash buffer of 2% to 5% provides dry powder to add to high-conviction positions if quality names sell off on headline fear rather than fundamental deterioration.
Five prudent positioning strategies:
- Trim high-duration growth exposure by 5% to 15% if futures pricing shows rising odds of a hawkish surprise. Rotate proceeds into value, financials, or short-duration bonds.
- Increase cash allocation to 2% to 10% to preserve liquidity and create capacity for opportunistic buys during post-announcement volatility.
- Use small hedges, 1% to 3% of portfolio, via puts, put spreads, or inverse ETFs to cap tail risk without betting the house on a specific outcome.
- Avoid large, concentrated bets in the 24 hours before and after the announcement. Elevated bid-ask spreads and thin liquidity can result in poor execution and unexpected slippage.
- Set explicit rebalancing rules in advance, like “If S&P 500 falls more than 3%, add X% to equities. If it rallies more than 2%, trim Y%” to remove emotion from decision-making during volatile windows.
Final Words
Markets are braced for the Fed; this piece ran through policy odds (hold vs cut), how futures price those bets, and why Fed wording moves stocks.
We compared historical post‑decision moves, broke down sector winners and losers, listed the data the Fed watches, shared consensus odds and timing, and suggested practical positioning.
If you need one quick line on what to expect from the fed meeting for stocks: expect headline-driven volatility, sector rotation, and reaction to Fed language — so size trades, use stops, and you’ll be ready to act.
FAQ
Q: Will the stock market go up with a Fed rate cut?
A: A Fed rate cut can lift stocks but isn’t guaranteed. Cuts often lower borrowing costs and boost growth expectations, helping cyclicals and tech, yet market reaction depends on guidance, inflation signals, and positioning.
Q: What does a Fed meeting mean for stocks?
A: A Fed meeting means updated policy and guidance that can change interest-rate expectations, risk sentiment, and sector leadership; markets react to the decision itself and the Fed’s language about the path forward.
Q: Should I pull my money out of the stock market?
A: You should not automatically pull money out of the stock market before a Fed meeting. Consider time horizon, risk tolerance, diversification, and targeted hedges; selective trimming or reduced leverage is often preferable to a full exit.
Q: Who owns 93% of the stock market?
A: The claim that 93% of the stock market is owned by a small group refers to institutional investors and the wealthiest households holding most market value, not that a literal 93% of individual shares are owned by one group.