

Think the Fed’s next move is certain? Think again.
Fed funds futures are pricing real-time odds that tell a different story: roughly 70% chance of a hold and about 30% chance of a 25-basis-point cut at the next meeting.
These are not guesses — they’re bets in CME futures that update with every CPI print, payrolls report, and Fed speech.
This post breaks down how those probabilities are calculated, why they swing, and what shifts in odds mean for bonds, stocks, and your portfolio heading into the meeting.
Current Fed Rate Hike, Cut, and Hold Probabilities (Real-Time)
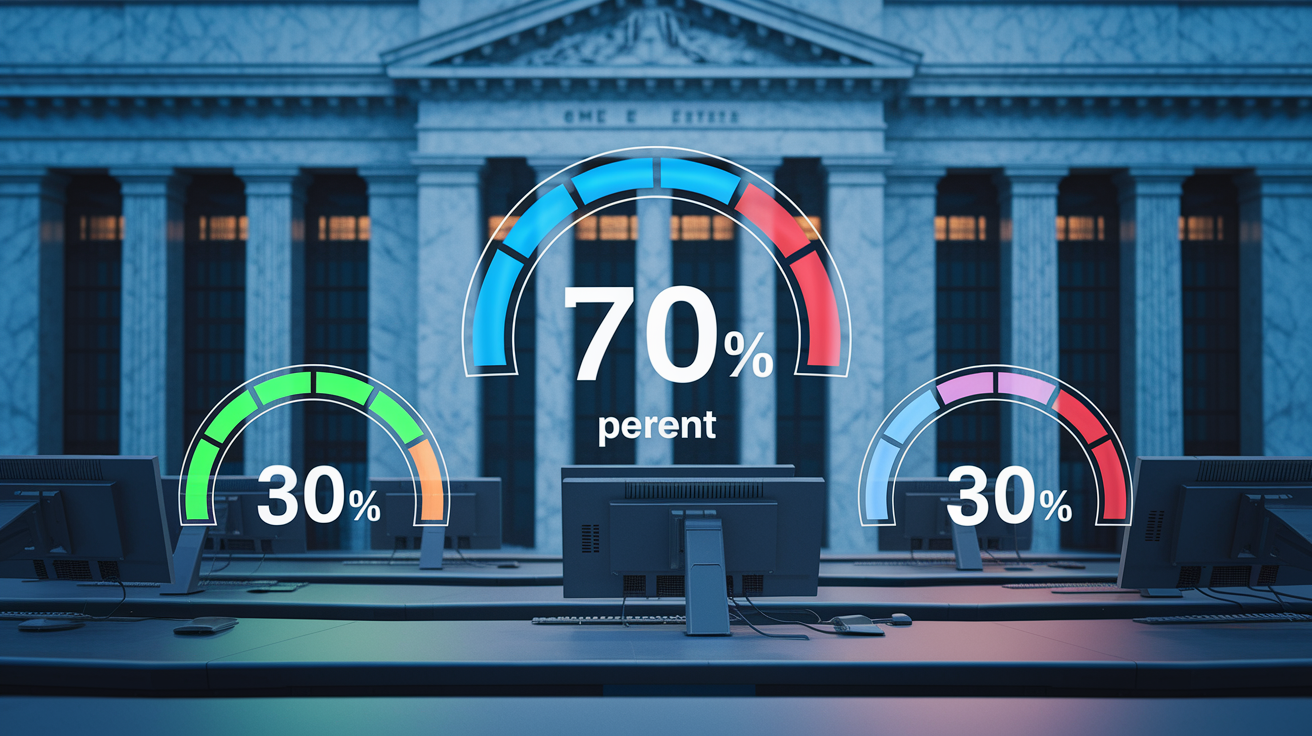
Fed funds futures aren’t pricing any chance of a hike at the next meeting. Right now, the market’s putting about 70 percent odds on a hold, which would keep the target range at 3.50 to 3.75 percent. The remaining 30 percent goes to a quarter-point cut. These numbers come from real money at work in CME Group futures contracts, and they update constantly as new data drops, Fed officials talk, or financial conditions shift.
What you’re seeing is a market that’s comfortable staying put but hasn’t completely closed the door on a near-term cut. That 30 percent cut probability tells you traders think there’s a decent chance upcoming inflation or jobs data could move the Fed sooner than its own guidance suggests. A big surprise in CPI or payrolls before the meeting? These percentages can swing 10 to 20 points before lunch.
Here’s where things stand:
- Hold (unchanged): ~70% — the committee keeps the current 3.50–3.75% range in place.
- 25 bps cut: ~30% — the Fed starts easing this meeting if data softens or conditions tighten.
- 25 bps hike: ~0% — futures aren’t pricing any scenario where tightening resumes.
| Scenario | Probability | Futures-Implied Rate |
|---|---|---|
| Hold (3.50–3.75%) | ~70% | 3.640% |
| 25 bps Cut (3.25–3.50%) | ~30% | 3.515% |
| 25 bps Hike (3.75–4.00%) | ~0% | 3.765% |
These probabilities come from monthly fed funds futures that settle to the average effective federal funds rate during the contract month. The pricing reflects what professional traders and institutions are willing to bet based on where they think Fed policy is headed. When you see cut odds jump from 10 percent to 30 percent, real money moved and the market just repriced the likelihood of easing.
How Fed Funds Futures Generate These Probabilities

Fed funds futures are interest rate derivatives that settle to the monthly average of the effective federal funds rate. Each contract gets quoted as 100 minus the implied rate, so a price of 96.36 translates to an implied effective rate of 3.64 percent. When the current rate is one number and the futures contract prices a different rate for a specific month, that gap tells you what change the market expects between now and expiration.
The probability math assumes discrete 25 basis point steps because that’s how the Fed typically moves. If the current effective rate sits at 3.640 percent and the front-month futures contract implies 3.515 percent after the meeting, the expected change is roughly 12.5 basis points. Divide that by the standard step size (12.5 bps ÷ 25 bps) and you get a 50 percent probability of a quarter-point cut. Bigger gaps mean probabilities shift accordingly. Multi-meeting probabilities build a decision tree that chains individual meeting odds together and assigns cumulative likelihoods to different rate paths.
The model’s sensitive to your step-size assumption. Switch to 50 basis point increments and the same futures price spits out different probabilities. The tool updates throughout the trading day using delayed market prices, so intraday moves in CPI, payrolls, or Fed speeches can reshape the whole distribution in minutes.
Factors That Influence Shifts in Rate Probabilities

Economic data releases drive most of the action. The Consumer Price Index, Personal Consumption Expenditures index, and nonfarm payrolls carry the most weight because they directly inform the Fed’s dual mandate. When core CPI prints hotter than consensus, futures-implied odds of a hold or hike jump. When the unemployment rate ticks up or wage growth cools, cut probabilities climb.
Fed communication moves probabilities just as fast. A hawkish speech from the Chair or a voting member can erase 15 percent of cut probability in an hour. A member signaling comfort with the current rate or mentioning growth risks? Markets shift toward easing. FOMC minutes and the quarterly Summary of Economic Projections publish the committee’s own median rate forecast (the “dot plot”), and when that conflicts with futures pricing, one side usually adjusts.
Financial conditions matter too. If credit spreads widen sharply, equity volatility spikes, or funding markets tighten, the Fed might need to ease even if inflation’s sticky. Futures traders watch the Goldman Sachs Financial Conditions Index, corporate bond spreads, and swap spreads for early signals.
Key data and events that move Fed funds futures odds:
- Consumer Price Index (CPI): headline and core monthly prints. Higher inflation equals lower cut odds.
- Nonfarm Payrolls (NFP): job growth and unemployment rate. Strong payrolls support a hold or hike, weak payrolls boost cut odds.
- Personal Consumption Expenditures (PCE): the Fed’s preferred inflation gauge. Sticky PCE delays easing.
- ISM Manufacturing and Services: leading indicators of growth. Weak ISM supports the cut case.
- Fed speeches and press conferences: voting members’ tone on data dependence, inflation progress, and labor market balance.
- Financial conditions indexes and credit spreads: tightening increases easing odds, easing increases hold or hike odds.
- Treasury yields and dollar moves: front-end yields and the dollar often lead or confirm futures-based pricing shifts.
Recent Trends in Market-Implied Odds
Over the past three months, futures-implied probabilities shifted from pricing multiple additional hikes to pricing the first potential cut. In early spring, markets assigned roughly 40 percent odds to at least one more quarter-point hike by mid-year. That probability collapsed after three consecutive softer CPI prints and Chair Powell’s commentary signaling a “hold and assess” posture. By late May, hike odds had dropped below 5 percent.
Cut probabilities started building in June. The initial read showed only 10 percent odds of a rate cut at the next meeting, with most easing expectations pushed to late summer or early fall. A weaker than expected jobs report in early June caused a sharp intraday jump. Cut odds spiked from 10 percent to nearly 25 percent within hours. Over the following two weeks, as inflation data came in mixed and Fed speakers emphasized patience, probabilities settled near current levels.
The trend over time shows markets continually repricing the timing of the first cut rather than debating whether cuts happen at all. Front-month meeting probabilities have been volatile, swinging 10 to 20 percentage points around data releases. Probabilities for meetings three and six months out show a smoother path toward cumulative easing of 50 to 75 basis points by year-end. This pattern reflects the market’s base case: the Fed’s done hiking, but the exact start date for cuts depends on incoming data confirming sustained disinflation and labor market cooling.
Historical Accuracy of Fed Funds Futures

Research shows fed funds futures get more accurate as the decision date approaches. Studies covering the past two decades find that one week before an FOMC meeting, futures-implied probabilities align with the actual decision roughly 85 to 90 percent of the time. The accuracy drops when you look further out. Probabilities derived six weeks before a meeting show a success rate closer to 70 percent because more economic data and Fed communication can still arrive and shift expectations.
Periods of high accuracy typically happen when the Fed has clearly signaled its next move through forward guidance or when the economic data trend is obvious. During the tightening cycle of 2022 and early 2023, futures correctly priced nearly every hike because Chair Powell and other officials repeatedly emphasized a “higher for longer” stance and inflation remained elevated. The market had clarity on direction even if the exact terminal rate was uncertain.
Historical breakdowns happen when the Fed surprises or when an unexpected economic shock arrives between the last data release and the meeting. In March 2020, futures pricing collapsed within 48 hours as the pandemic forced emergency inter-meeting cuts. Similarly, in mid-2019, markets priced aggressive easing that the Fed only partially delivered, creating a mismatch between futures odds and actual decisions. The lesson? Futures reflect market expectations at a point in time. They’re a snapshot, not a guarantee, and they can be wrong when new information fundamentally changes the policy calculus.
Implications for Investors and Market Positioning

When cut probabilities rise, bond markets typically rally. The front end of the yield curve (2-year and 5-year Treasuries) reprices lower as traders anticipate a lower policy rate path. If futures shift from 70 percent hold to 70 percent cut, you often see 10 to 15 basis points drop in 2-year yields within a single session. Duration-sensitive assets like investment-grade corporate bonds and mortgage-backed securities benefit because lower policy rates reduce discount rates on future cash flows.
Equity markets respond based on the reason behind changing odds. If cut probabilities increase because of weakening growth or rising recession risk, equities can sell off even as bonds rally. But if the market interprets higher cut odds as the Fed engineering a “soft landing,” risk assets often rally alongside bonds. The sector rotation matters. Rate-sensitive sectors like utilities and REITs outperform when easing expectations build, while financials can underperform if the yield curve flattens further.
Currency and commodity traders watch Fed odds closely. A shift toward higher cut probabilities tends to weaken the dollar because lower U.S. rates reduce the interest rate differential versus other major currencies. Gold often rallies when real yields fall in anticipation of cuts. Credit spreads can tighten if easing expectations reduce recession risk, or widen if the market fears the Fed is responding to a sharper slowdown.
Common investor and trader strategies around shifting Fed odds:
- Duration positioning: lengthen bond duration when cut probabilities rise, shorten or hedge when hike odds increase.
- Equity sector rotation: overweight rate-sensitive sectors (utilities, REITs, consumer staples) when easing is priced, rotate to cyclicals and financials when tightening odds build.
- FX trades: fade the dollar when Fed easing expectations rise relative to other central banks, buy the dollar when Fed hike odds increase or hold odds firm while others ease.
- Volatility hedging: buy short-dated options or VIX calls around FOMC meetings when probabilities are near 50/50 (maximum uncertainty equals higher realized volatility).
Final Words
Markets are trading on shifting odds for the next Fed move, and fed funds futures are the clearest snapshot.
This post walked through current probabilities, how futures create those odds, what moves them, recent trends, historical accuracy, and why investors reposition.
Keep monitoring intraday changes — fed funds futures odds before fed meeting can swing with a single data print or Fed comment. Use those shifts to shape positioning, not make bets. Positive note: clearer odds mean clearer choices.
FAQ
Q: What is the future projection for the Fed funds rate and is a Fed rate cut expected?
A: The future projection for the Fed funds rate and expectation of a cut are driven by market-implied odds (futures); near-term outlook varies with data—markets often split between hold and possible cut, timing still uncertain.
Q: Will stocks go up if the Fed cuts rates?
A: Stocks will sometimes rally if the Fed cuts rates, but markets weigh growth, earnings, and positioning; rate cuts can help stocks, yet the reaction depends on why the Fed eased.
Q: Will interest rates drop to 3% again?
A: Interest rates dropping to 3% again is possible over time but depends on inflation, growth, and Fed action; check market-implied futures probabilities for a clearer signal on timing.