

What if the vertical bars under every price chart tell you more than the candles ever will?
That’s volume: a simple count of every share traded in a set time, and it shows real interest and how easy you can get in or out.
Read this to learn what volume actually measures, where to find it on charts, why spikes confirm moves, how low versus high volume changes risk, and three quick rules beginners can use to judge whether a price move matters.
Core Explanation of Stock Market Volume for Beginners

Volume counts every share that traded hands during a set timeframe, usually a day. If 100 shares change hands through completed buy and sell orders, that session’s volume is 100. It doesn’t track individual buyers or sellers. It just adds up shares moved, period.
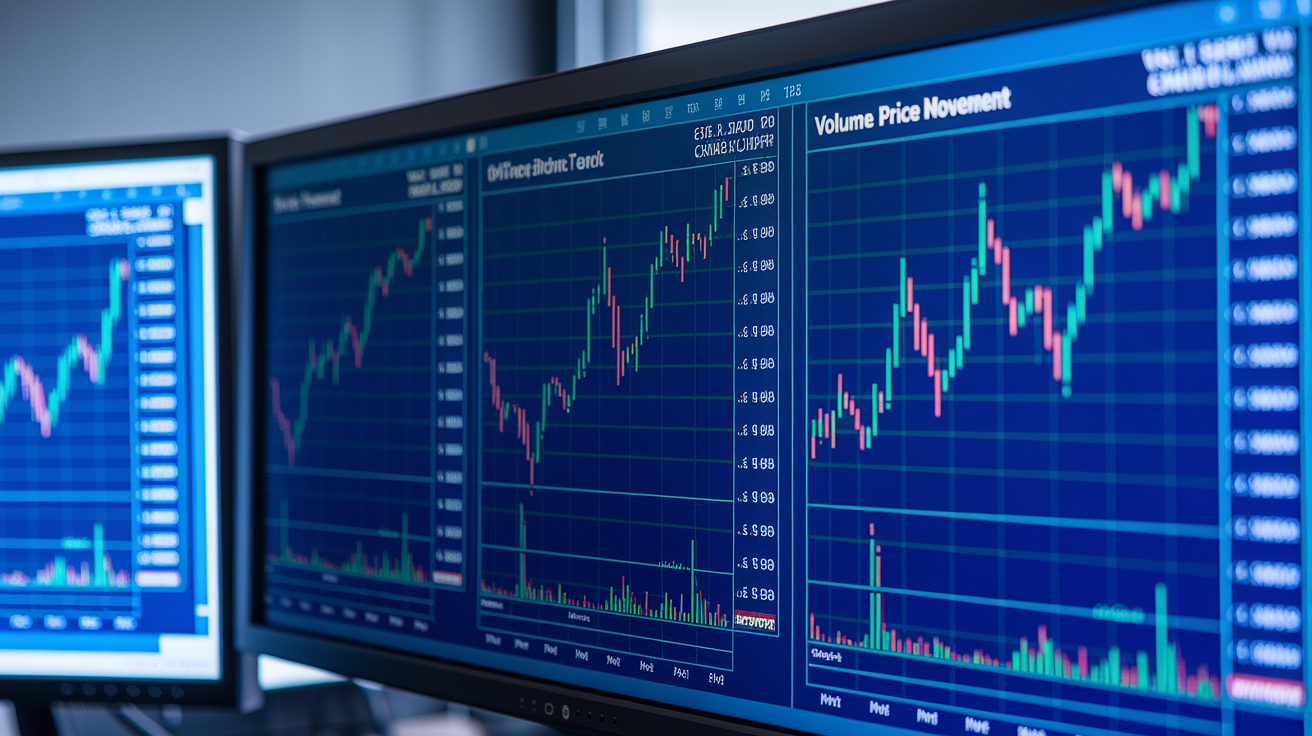
You’ll see volume as vertical bars underneath price charts. Each bar shows the total traded during that interval, whether it’s one minute, one hour, or a full day. Tall bars mean lots of action. Short bars? Not much going on.
Why does it matter? Volume tells you how much interest is flowing into a stock and whether you can actually trade it without headaches. High volume means plenty of people are participating, so you can jump in or out fast without getting stuck. Low volume means the opposite: fewer players, wider spreads between buy and sell prices, and you might not get filled at the price you want.
- What it actually counts: Every share traded in that window, showing you total transaction activity.
- Finding it on your chart: Those vertical bars below the candles or lines. Taller equals busier.
- Why spikes grab attention: Sudden volume jumps usually mean news broke, earnings dropped, or sentiment just shifted hard.
- High versus low, simplified: High volume backs up price moves and keeps things liquid. Low volume? Weak participation, trends you can’t always trust.
How Stock Market Volume Is Measured and Displayed

Exchanges like the NYSE and NASDAQ publish official volume numbers when the session ends. During the day, real-time data flows to your broker and charting platform, updating as trades happen. Each bar covers a specific slice of time. Minute bars for day traders watching every tick. Daily bars for investors checking in once a day. Some platforms color-code the bars: green when buying pressure dominated that period, red when selling took over.
Long-term folks usually stick with daily or weekly bars to catch broader shifts over months. Short-term traders live in the minute and hourly charts, hunting momentum and confirming whether breakouts are real or fake. Advanced tools layer in volume moving averages—20-day, 50-day—so you can compare today’s action against recent norms and spot when something unusual is happening.
| Period | How Volume Is Displayed |
|---|---|
| Minute | Shows shares traded in 60 seconds; day traders use this to track live momentum shifts |
| Hour | Combines all minute bars into one-hour totals; helps catch patterns like morning surges and afternoon fades |
| Day | Total shares for the full session; standard view for swing traders and most investors |
| Week | Stacks five trading days into one bar; smooths out daily chop for cleaner medium-term reads |
| Month | Roughly 20 trading days rolled together; used for long-term trend checks and historical context |
Volume vs Float vs Market Cap in Stock Trading

Volume just counts shares traded. It won’t tell you how many shares exist or what the company’s worth. Float is the number of shares floating around for public trading, not counting restricted chunks locked up by insiders or big institutions. Low-float stocks might have 10 million to 20 million shares available. Big names can have billions. Low float amplifies swings because even modest buying or selling moves the needle fast when there aren’t many shares to go around.
Market cap multiplies total outstanding shares by current price. Large caps run from $10 billion up past $200 billion. Small caps sit between $250 million and $2 billion. Market cap tells you company size and often ties to liquidity, but a huge market cap doesn’t guarantee high daily volume. If nobody’s interested or most shares are locked up, volume stays thin no matter how big the company is.
- Volume measures daily trading flow and can swing wildly when sentiment shifts or news hits.
- Float sets the upper limit on tradable shares; smaller float means bigger percentage moves when volume cranks up.
- Market cap shows company value but doesn’t predict volume; actual trading activity depends on investor interest and accessibility, not size alone.
What Stock Market Volume Indicates About Price, Liquidity, and Interest

When volume climbs with price, it confirms more people are jumping in at these levels. Price up, volume up? That’s conviction behind the rally. Price down, volume up? Serious selling is underway and the downtrend probably has legs. Volume checks whether a price move is real or just a few orders pushing things around. A sharp spike on thin volume might reverse fast. The same spike on heavy volume means the crowd agrees.
High volume tightens bid-ask spreads and speeds up fills because there are more orders sitting in the book. You get less slippage, better execution. Low volume creates the reverse: wider spreads, slower fills, more slippage. Two stocks can both climb 5 percent in one day, but if Stock A moved 10 million shares and Stock B only moved 200,000, Stock A’s move carries more weight. It reflects broader agreement.
Volume also signals where the big money is active. Institutions need liquid, high-volume names because they can’t shove millions of dollars into a thin stock without moving the price against themselves. Volume surges often hit around earnings, regulatory news, mergers, or macro data drops. Tracking volume helps you spot when a sleepy stock suddenly wakes up or when a busy name goes quiet as interest dries up.
| Price Direction | Volume Direction | Interpretation |
|---|---|---|
| Rising Price | Rising Volume | Strong bullish backing; trend has support and could keep running |
| Rising Price | Falling Volume | Momentum fading; rally might lack conviction and face pullback risk |
| Falling Price | Rising Volume | Heavy selling pressure; downtrend likely has staying power |
| Falling Price | Falling Volume | Selling could be running dry; watch for stabilization or bounce if buyers show up |
Common Volume Patterns Traders Watch

Volume patterns separate signal from noise. A volume spike is when daily or intraday volume jumps well past the recent average, usually because news just broke, earnings surprised, or an analyst changed their call. Spikes confirm something real just shifted in how the market sees the stock. Traders lean on these spikes to validate breakouts or catch turning points, since normal-volume moves can fade but heavy-volume moves tend to stick.
Exhaustion moves pair big price swings with big volume spikes and often mark the end of a run. When a stock rockets or tanks in one session on the highest volume in weeks, buyers or sellers might be tapped out. The next day often shows smaller moves or even reversals because the crowd ran out of fresh firepower. Breakout confirmation depends on volume: a stock popping above resistance on light volume suggests a weak or fake break. A breakout with a volume surge? That’s real demand and better odds of follow-through.
Reversals can show up when volume rises but price movement slows down. If a stock’s been climbing steadily and volume starts increasing as price stalls near a peak, that split can warn of a coming pullback. Divergence between price and volume also pops up when a stock hits new highs on lower and lower volume, hinting fewer traders back the rally. Bullish continuation patterns match rising volume with shallow pullbacks: stock rises, dips slightly on lighter volume, then rises again on heavier volume. That tells you buyers are still in charge.
Intraday volume follows a rhythm most days. Volume usually peaks in the first hour after the open as overnight news and queued orders flood in. Then it drops through midday when catalysts dry up and traders step away. The last hour before the close sees another surge as day traders close out, funds rebalance, and closing auctions process stacked orders.
- Volume spikes: Sudden jumps past average, tied to news or events; confirm real sentiment shifts.
- Exhaustion moves: Sharp price and volume spikes together; often signal the trend’s losing steam and volatility will calm down.
- Breakout confirmation: High volume on a breakout means strong demand; low volume hints it’s probably false.
- Reversals: Volume climbing while price stalls; warns momentum’s shifting and a pullback could be next.
- Divergence: Price hits new highs or lows but volume drops; shows weakening participation and possible trend exhaustion.
- Intraday cycles: Volume spikes at open and close, sags midday; knowing this helps you time entries and exits better.
Beginner Rules for Interpreting Stock Market Volume

Compare today’s volume to the stock’s 20-day or 50-day average. Way above average? The move probably matters. Below average? It might not hold. Look for volume spikes around earnings, economic prints, or breaking news. Those events drive the biggest volume days and often set new short-term trends. Don’t trade on volume alone. Pair it with price patterns, support and resistance, and at least one other tool before you pull the trigger.
- Stack it against average volume: Use a moving average to see when current activity is unusually strong or weak.
- Track news-driven spikes: Earnings, guidance tweaks, and headlines often trigger volume surges that confirm or flip trends.
- Don’t rely on volume by itself: Volume shows how much traded, not why; always combine it with price action and risk rules.
- Let volume confirm trends: Price rising with volume rising backs the rally; price rising with volume falling raises red flags.
- Check liquidity first: Low-volume stocks can give you terrible spreads and bad fills; more volume usually means smoother trades.
Key Volume Indicators (OBV, VPT, Ease of Movement)
Volume indicators turn raw volume into trend signals and momentum gauges. They blend volume with price changes to create lines or numbers that either back up or challenge what price is doing. Most beginners start with one or two to keep charts clean and avoid missing the core relationship.
On-Balance Volume
On-Balance Volume (OBV) is cumulative. It adds the day’s volume when the close is higher than yesterday’s close and subtracts it when the close is lower. The actual OBV number doesn’t matter much. What matters is where the line’s headed. OBV climbing with price climbing? Trend’s got backing. OBV falling while price climbs? Rally’s shaky and could reverse. OBV shines at catching divergences early. If price makes a new high but OBV doesn’t, selling pressure might be building underneath.
Volume Price Trend
Volume Price Trend (VPT) tweaks OBV by weighting each day’s volume by the percent price change. Instead of just adding or subtracting full volume, VPT multiplies volume by how much the price moved. A 2 percent gain on heavy volume adds more to VPT than a 2 percent gain on light volume. That makes VPT more responsive to the size of price moves and helps you spot when big volume backs big price changes, confirming momentum.
Ease of Movement
Ease of Movement measures how far price moved relative to volume. It takes the distance between the period’s high and low, then divides by volume. When a stock moves far on low volume, Ease of Movement spikes, suggesting little resistance. When price barely budges despite high volume, the reading stays low, pointing to strong resistance or support. Traders often use it over longer windows and in choppy markets to see whether price changes are meeting heavy opposition or flowing smoothly.
| Indicator | Purpose | Best Use Case |
|---|---|---|
| On-Balance Volume (OBV) | Cumulative tracker that confirms trend direction and spots divergences | Finding hidden weakness in rallies or hidden strength in selloffs |
| Volume Price Trend (VPT) | Cumulative volume weighted by percent move to gauge momentum | Confirming big price moves are matched by proportional volume increases |
| Ease of Movement | Links price range to volume to show how easily price shifts | Checking resistance levels and finding low-resistance breakout setups |
Real Examples of High-Volume and Low-Volume Market Behavior
A high-volume breakout happens when a stock sits in a tight range for weeks, then pops above resistance on volume two or three times the daily average. The surge confirms broad buying interest and raises the odds the breakout sticks. Traders entering on these moves often see follow-through in the next few sessions as momentum pulls in more buyers. Low-volume rallies drift higher over several days on thin activity. These often reverse fast because only a handful of participants pushed price up, and the first round of profit-taking or bad news can wipe out the gains.
Volume spikes on earnings show how event-driven flow changes everything. A company reports after the close. Next morning, volume jumps to five times normal as traders react. If earnings beat and volume stays elevated all session, the move’s got backing. If volume spikes at the open but fades by lunch, the initial reaction was probably overdone and the stock could settle back near pre-earnings levels.
- High-volume breakout: Stock averages 10 million shares daily; breaks resistance on 35 million, signaling strong demand and better odds of continuation.
- Low-volume rally: Stock climbs 8 percent over three days on 60 percent of average volume; lacks broad support and risks quick reversal when sellers return.
- Earnings volume spike: Daily volume rockets from 2 million to 12 million after results; staying elevated through the close confirms the market accepts the news; fading by afternoon hints at overreaction.
Final Words
in the action, we defined volume as the number of shares traded in a set period and showed how it appears as bars under price charts.
We covered how exchanges report volume, the difference between volume, float and market cap, how volume links to price and liquidity, common patterns to watch, beginner rules, and simple indicators like OBV, VPT, and Ease of Movement.
If you’re asking what is volume in stock market, it’s the raw share count that helps confirm moves and show liquidity. Start tracking it against averages—small habit, big clarity.
FAQ
Q: What does stock volume tell you?
A: The stock volume tells you the total shares traded in a period and signals interest, liquidity, and conviction—higher volume means stronger market interest and easier trade execution; low volume suggests weak interest and wider spreads.
Q: What is a good volume for a stock?
A: A good volume for a stock depends on its average daily volume and size; generally, higher-than-average volume or several million shares for small caps indicates better liquidity and tighter bid‑ask spreads.
Q: How much is 1 volume in stocks?
A: One volume in stocks equals one share traded; volume is the simple count of completed share transactions, so 100 trades produce volume of 100.
Q: Is high volume good for a stock?
A: High volume is generally good because it shows strong interest and improves liquidity, making price moves more reliable; however, context matters—news, earnings, or manipulation can also cause spikes.