


Think a stock market crash means the whole economy has collapsed? Not necessarily.
A crash is a very fast, large drop in major indexes — often 10 percent or more in days — that can still spill into credit, jobs, and confidence.
This post explains what a crash really is, why crashes happen, how they differ from routine corrections or bear markets, and what the likely effects are for investors and the economy.
Read on for clear signs to watch and practical steps to avoid panicking.
Clear Explanation of What a Stock Market Crash Means
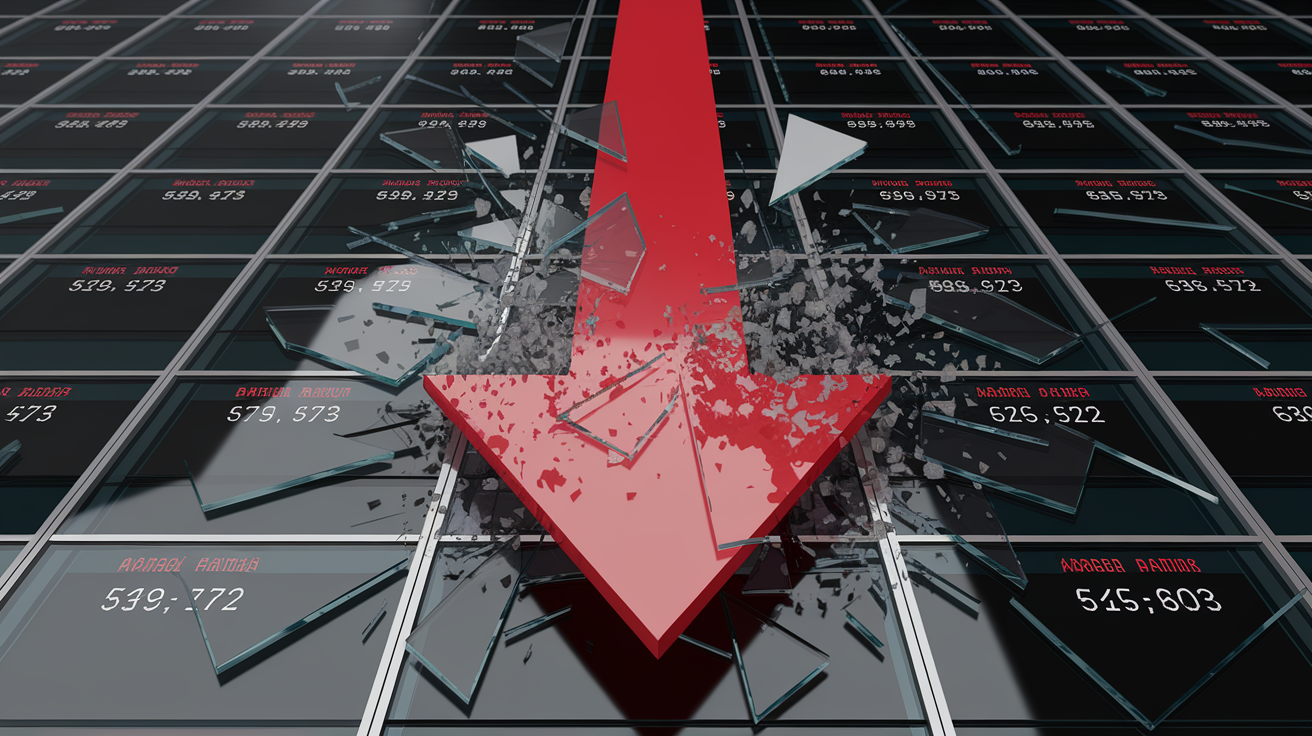
A stock market crash is when prices drop hard and fast across the big indexes: Dow Jones, S&P 500, Nasdaq. We’re not talking about the whole economy here. Just these benchmarks that track hundreds or thousands of public companies. Crashes usually mean a 10 percent drop or worse, compressed into days or weeks instead of months. The speed is what separates a crash from the normal up-and-down you see every day (S&P 500 typically moves between −1 percent and +1 percent).
You need to know three related terms. A correction is a 10 percent pullback from a recent peak. Pretty common during bull runs. Bear markets kick in when an index falls 20 percent or more below its 52‑week high, signaling deeper trouble that tends to stick around. Crashes share that magnitude but happen way faster, sparking panic and forced selling in tight timeframes. The S&P 500 dropped nearly 12 percent on March 16, 2020. Single day. That’s crash territory.
U.S. markets have circuit breakers to slow things down when selling gets out of hand. Level 1 halts trading for 15 minutes if the S&P 500 falls 7 percent from the prior close. Level 2 pauses again at 13 percent down. Level 3 shuts everything for the rest of the day at a 20 percent drop. These safeguards came after Black Monday in 1987 and have only triggered a handful of times since. Most recently during the COVID selloff in March 2020. They give everyone a forced timeout to process what’s happening and prevent algorithms and emotions from feeding on themselves.
Key Causes Behind a Stock Market Crash

Crashes don’t appear out of thin air. They’re what happens when systemic weak spots meet sudden shocks. Asset bubbles set the stage. When stock prices climb way past what earnings or economic growth justify, valuations get fragile. Then something hits: a geopolitical event, a pandemic, a credit freeze, a policy mistake. The bubble pops. Leverage makes it worse. Investors who borrowed money to buy stocks (on margin) get forced to sell when prices fall, pushing prices even lower and setting off more margin calls in a feedback loop.
Algorithmic trading can turn a selloff into a crash by accelerating the pace. Automated systems react in milliseconds. If a bunch of programs are coded to sell at similar thresholds, the combined volume overwhelms buyers. Liquidity dries up. When nobody wants to buy, prices gap down sharply until they find anyone willing to step in at any level.
Most common triggers:
- Bursting asset bubble – Overvaluations snap back when reality shows up
- Economic shock – Recession fears, GDP contraction, sudden unemployment spike
- Geopolitical or health crisis – War, pandemic, terror event, energy disruption
- Excess leverage and margin calls – Borrowed positions force mass liquidation
- Liquidity freeze – Credit markets seize, buyers disappear, bid-ask spreads blow out
Historical Stock Market Crash Examples and What They Show
Looking at past crashes helps you spot patterns, understand causes, gauge typical recovery paths. Each one had different triggers but shared certain traits: rapid declines, high volatility, margin stress, eventual stabilization once the shock got absorbed or policy stepped in.
| Date/Period | Index Move | Key Cause | Aftermath |
|---|---|---|---|
| October 1929 | Dow fell ~13% Oct 28, ~12% Oct 29 | Overvaluation, margin speculation, economic slowdown | Bottomed in 1932 down 89% from peak; recovery took over two decades |
| October 19, 1987 | Dow fell 22.6% in one day | Portfolio insurance, program trading, rising rates | Recovered within ~2 years; circuit breakers implemented |
| 1999–2000 Dot-Com | S&P fell nearly 50% peak to trough | Internet-stock bubble, unprofitable companies, hype valuations | Recovery took about 7 years |
| 2008 Financial Crisis | S&P fell ~57% from Oct 2007 to Mar 2009 | Subprime mortgages, Lehman collapse, credit freeze | Full recovery took ~2 years from the March 2009 low |
| Feb–Mar 2020 COVID | S&P fell ~34% in roughly one month | Pandemic shutdown fears, earnings collapse expectations | Recovered to prior levels by August 2020 (~6 months) |
Severity and recovery time vary widely. The 1929 crash turned into a multi-year depression. 2020 bounced back in months thanks to fast fiscal and monetary policy support. Speed of the decline doesn’t always predict length of the recovery, but crashes triggered by structural economic breakdowns (1929, 2008) tend to take longer to repair than those driven by sudden shocks that policy can address (2020).
How a Crash Impacts Markets, Investors, and the Economy

A crash sends shockwaves beyond ticker symbols. Portfolio values plunge. Months or years of gains can disappear in days. Investors with margin accounts get margin calls, demands to deposit more cash or sell holdings to cover borrowed money. Forced selling accelerates the decline. Unrealized losses stay on paper until you sell, but the psychological pressure and account-balance drop are immediate. Retirement accounts, college savings, brokerage portfolios all take hits, slashing household wealth and confidence.
The broader economy often follows markets down. Sharp stock declines tighten credit as banks get risk-averse, making it harder for businesses to borrow and expand. Corporate earnings expectations fall. Companies freeze hiring, cut staff, pull back capital spending. Consumer sentiment tanks. People cut discretionary spending. Recession risk rises. The 1929 crash preceded the Great Depression. The 2008 crash triggered the Great Recession with unemployment peaking near 10 percent.
Key economic impacts:
- Wealth destruction – Household net worth falls sharply
- Credit tightening – Banks pull back lending, raising borrowing costs
- Rising unemployment – Companies cut staff in response to falling demand
- Recession risk – Negative feedback loops between markets and the real economy
Not every crash leads to a recession, but the correlation is strong enough that policymakers watch market turmoil closely and often step in with rate cuts, liquidity support, or fiscal stimulus.
Warning Signs That Often Precede a Stock Market Crash

No indicator guarantees a crash is coming. But certain signals show stress building in the system. Recognizing these warning signs doesn’t mean you should sell everything. It means you should check your diversification, risk exposure, and whether you’re comfortable with your current allocation if volatility spikes.
Volatility and Market Stress Indicators
The VIX measures expected volatility in the S&P 500 over the next 30 days based on options pricing. People call it the market’s “fear gauge.” A low VIX (below 15) suggests complacency. A rising VIX (above 20 or 30) signals growing uncertainty and hedging demand. Sudden VIX spikes often coincide with sharp selloffs. The VIX jumped above 80 in March 2020 as the COVID crash unfolded. Before the market fell 34 percent, the VIX had already doubled in a matter of days, signaling stress before the worst of the decline hit. Other stress indicators include widening bid-ask spreads, declining trading volume in leadership stocks, and divergence where fewer stocks are driving index gains.
Economic and Credit Warning Signals
The yield curve, specifically the spread between 10‑year and 2‑year Treasury yields, has predicted most U.S. recessions when it inverts (short rates higher than long rates). An inversion suggests investors expect economic trouble and future rate cuts. Credit spreads, the difference between corporate-bond yields and Treasury yields, widen when lenders demand more compensation for default risk. Rising spreads mean credit is tightening, which can choke off business activity. Liquidity warnings appear when banks hoard cash, repo-market rates spike, or central banks inject emergency funding.
Common red flags before a crash:
- VIX rising above 20 or spiking sharply
- Yield curve inversion lasting multiple months
- Credit spreads widening 100+ basis points
- Extreme valuations (P/E ratios far above historical averages)
- Weakening economic data (GDP growth slowing, unemployment ticking up)
Differences Between a Market Crash and a Normal Correction

Understanding the distinction helps you avoid overreacting to routine pullbacks or underestimating genuine crashes. A correction is normal, healthy even. Indexes decline 10 percent from a peak, shake out weak hands, reset valuations slightly, then often resume climbing. Corrections typically unfold over weeks or a few months and don’t trigger systemic breakdowns. Bear markets involve deeper, longer declines of at least 20 percent and often last many months or even years, signaling a shift in the economic or earnings cycle.
A crash is different in speed and scope. Crashes happen in days, not weeks. They involve correlated selling across sectors, geographies, and asset classes. Circuit breakers may activate. Margin calls cascade. Liquidity evaporates. Volatility spikes to extremes. The emotional intensity is far higher, and the risk of forced selling turning a bad day into a systemic event is real.
| Term | Threshold | Typical Timing | Meaning |
|---|---|---|---|
| Correction | 10% decline from recent peak | Days to weeks | Normal volatility; often healthy pause in a bull market |
| Bear Market | 20% decline from 52‑week high | Months to years | Sustained downtrend; often tied to economic slowdown or recession |
| Crash | 10%+ drop in days (often much more) | Days to weeks | Sudden, severe decline; high panic, forced selling, systemic stress |
How Long Stock Market Crashes Usually Last

Depends on how you define “last.” The time from peak to trough? Or from trough back to breakeven? Mild to moderate declines (10 to 20 percent) often recover within a year if the underlying economy stays intact and earnings hold up. The 2020 COVID crash lost 34 percent in roughly a month, then recovered all losses by August 2020. Round trip of about six months. That speed was unusual, driven by unprecedented Federal Reserve intervention and fiscal stimulus.
Severe crashes tied to structural economic problems take longer. The 2000 Dot-Com bust saw the S&P 500 fall nearly 50 percent from peak to trough. It took about seven years to fully recover. The 2008 financial crisis erased nearly half the S&P’s value from the October 2007 peak to the March 2009 low, but aggressive policy action helped the index regain its prior high by early 2013. A recovery of roughly four years from the low. The 1929 crash was the outlier. The Dow didn’t return to its 1929 peak until the mid-1950s, a span of over two decades complicated by the Great Depression and World War II.
Recovery examples and timelines:
- 2000 Dot-Com bust – Recovery took ~7 years
- 2008 financial crisis – Recovery to prior peak took ~4 years from the March 2009 low
- 2020 COVID crash – Recovery in ~6 months
Investment Strategies for Managing a Stock Market Crash

The best defense gets built before a crash happens. Diversification spreads your money across asset classes: stocks, bonds, real estate, cash. A collapse in one area doesn’t wipe out your entire portfolio. A balanced portfolio holding 60 percent stocks and 40 percent bonds will fall less than an all-stock portfolio during equity crashes. The bond allocation can be a source of funds to rebalance without selling stocks at the bottom. Many investors use broad ETFs that hold thousands of securities, which reduces single-stock risk and smooths volatility.
Rebalancing means selling assets that have grown beyond your target allocation and buying those that have fallen below it. During a crash, that means selling some bonds (which may have held steady or risen) and buying stocks at depressed prices. Dollar-cost averaging, investing a fixed amount at regular intervals, helps remove emotion and timing guesswork. If you’re contributing to a 401(k) every paycheck, you’re already dollar-cost averaging. You buy more shares when prices are low. Risk tolerance matters. If a 20 percent drop keeps you awake at night, your allocation may be too aggressive. Adjusting before a crash reduces the chance you’ll panic-sell during one.
Emergency funds are critical. If you have three to six months of expenses in cash, you won’t be forced to sell stocks in a downturn to cover bills or unexpected costs. Long-term perspective historically supports staying invested. Since 1950, every 20 percent-plus S&P 500 decline has eventually recovered, though past performance doesn’t guarantee future results. Selling in a crash locks in losses. Holding through the trough lets you participate in the eventual rebound.
Six-step crash-management playbook:
- Know what you own and why – Keep written research on each holding; re-evaluate only with objective sell criteria
- Trust diversification – Spread across asset classes to reduce single-market risk
- Consider buying the dip – If emergency funds are in place and you have extra cash, allocate opportunistically
- Get a second opinion – A financial advisor provides impartial review and emotional support
- Focus on the long term – Selling during a downturn crystallizes losses
- Take advantage where appropriate – Strategies like Roth conversions can be attractive when values are depressed (consult a tax professional)
Behavioral Factors and Psychology During a Market Crash

Markets are made of people. People are wired to avoid pain more than they seek gain. During a crash, fear overrides logic. Panic selling intensifies declines as investors rush for the exits simultaneously, creating a liquidity vacuum. Herd behavior spreads losses. When everyone sells, prices gap lower, triggering more sales in a self-reinforcing spiral. Social media and 24‑hour news cycles amplify volatility by broadcasting worst-case scenarios in real time, making it harder to tune out the noise and stick to a plan.
Sentiment indicators like the Fear & Greed Index measure emotional extremes. Readings at “extreme fear” often coincide with market bottoms, while “extreme greed” can signal tops. The irony is that the best buying opportunities often appear when fear is highest and the worst selling decisions happen when panic peaks. Margin calls force rational investors to sell at irrational prices. Retail investors without margin can still be psychologically forced out by seeing their account balances plunge.
Major psychological traps during crashes:
- Recency bias – Believing the recent trend (down) will continue forever
- Loss aversion – Fear of further losses drives selling at the worst time
- Herd mentality – Following the crowd into panic instead of sticking to a disciplined plan
Identifying Opportunities That Can Arise During a Crash

Crashes are destructive. But they also reset valuations and create opportunities for disciplined investors with cash and patience. High-quality companies with strong balance sheets, consistent earnings, and competitive advantages often get sold off indiscriminately alongside weaker peers. Value investors look for stocks trading well below intrinsic value, using metrics like price-to-earnings and price-to-book to identify bargains. The key is distinguishing between a temporary markdown and a permanent impairment. Some companies never recover.
Safe-haven assets often behave differently during equity crashes. Gold has historically held value or risen when stocks fall sharply, though the correlation isn’t perfect. U.S. Treasury bonds typically rally as investors flee risk and seek guaranteed returns, pushing yields down and bond prices up. Cash becomes the flexibility tool, allowing you to buy assets at distressed prices without selling anything else. The 2020 crash rewarded investors who had dry powder. The S&P 500 bottomed in March and gained over 60 percent by year-end.
| Asset/Strategy | Typical Behavior in Crashes | Key Consideration |
|---|---|---|
| Value stocks | Often oversold relative to fundamentals | Requires research to separate value from value traps |
| Quality companies | Temporary price drops but earnings resilience | Strong balance sheets and cash flow support recovery |
| Gold | May hold steady or rise as a hedge | Correlation to equities varies; not a guaranteed safe haven |
| Treasury bonds | Typically rally as yields fall | Provide stability and can be sold to rebalance into stocks |
| Cash | Preserves value and provides buying power | Opportunity cost if markets recover quickly |
Final Words
We defined a stock market crash as a sudden, large index drop, then laid out causes, historical examples, and why circuit breakers exist. You saw how crashes differ from corrections and bear markets, what warning signs to watch, and how crashes affect the economy and investors.
Practical takeaways: diversify, rebalance, keep an emergency fund, use dollar-cost averaging, and watch volatility and credit signals.
If you wonder what does a stock market crash mean, it’s painful short-term but also creates disciplined opportunities for prepared investors.
FAQ
Q: What actually happens if the stock market crashes?
A: If the stock market crashes, stock prices tumble rapidly, major indexes drop double digits, volatility surges, trading may be paused, liquidity tightens, and many investors face large portfolio losses and forced selling.
Q: Can I lose my 401k if the market crashes?
A: You can lose 401k value during a crash, but you don’t lose the account itself unless you withdraw. Staying invested, diversified, and patient usually helps retirement balances recover over time.
Q: Is it good to buy during a stock market crash?
A: Buying during a crash can be a good move for long-term investors because lower prices create opportunities, but it depends on your cash, risk tolerance, and picking resilient, well-valued assets.
Q: Why did the 2008 stock market crash?
A: The 2008 crash happened when a U.S. housing bubble burst and mortgage-backed securities collapsed, causing massive bank losses, frozen credit, and rapid global financial panic.