


Think volatility is just market chaos? Think again.
It’s a measure of how wild prices move, not whether they go up or down.
Knowing volatility tells investors how risky the ride could be, how to size trades, and when to hedge.
This post breaks down what volatility actually measures, the key ways it’s calculated, and how to turn those percent numbers into real dollar risks and clear actions.
No math degree required.
Clear Explanation of Stock Market Volatility

Volatility measures how much and how fast prices move over a given stretch of time. It doesn’t tell you if a stock’s going up or down. Just how bumpy the ride is.
A stock that jumps 5% one day and drops 4% the next? More volatile than one moving 0.3% either way. Both might end the week flat, but the swings are totally different.
Investors treat volatility as shorthand for uncertainty. High volatility means prices become harder to predict, and short-term moves get bigger. That raises the odds of sharp losses or sharp gains in a tight window. If you’re working with a short timeline or you can’t stomach big drawdowns, high-volatility holdings need closer attention.
There are two flavors of volatility. Realized volatility looks backward, it calculates how much a stock’s returns actually bounced around in the past using historical prices. Implied volatility looks forward, reflecting what the market thinks future swings will be based on option prices right now. Both get expressed as percentages and standard deviations. Realized tells you what happened. Implied tells you what the crowd’s pricing in for the near term.
Here’s how volatility gets interpreted in practice:
- Magnitude, not direction – A 20% annualized volatility means the stock could move roughly 20% in either direction over a year, within one standard deviation.
- Higher volatility signals higher risk – Bigger, more frequent price swings increase the chance of unfavorable outcomes in the short run.
- Volatility fluctuates over time – Markets cycle between calm stretches and stressed periods. Volatility itself is dynamic.
- Annualized figures are standard – Most volatility stats are quoted yearly, even though daily or weekly data drives the calculation.
Core Methods Used to Measure Stock Volatility
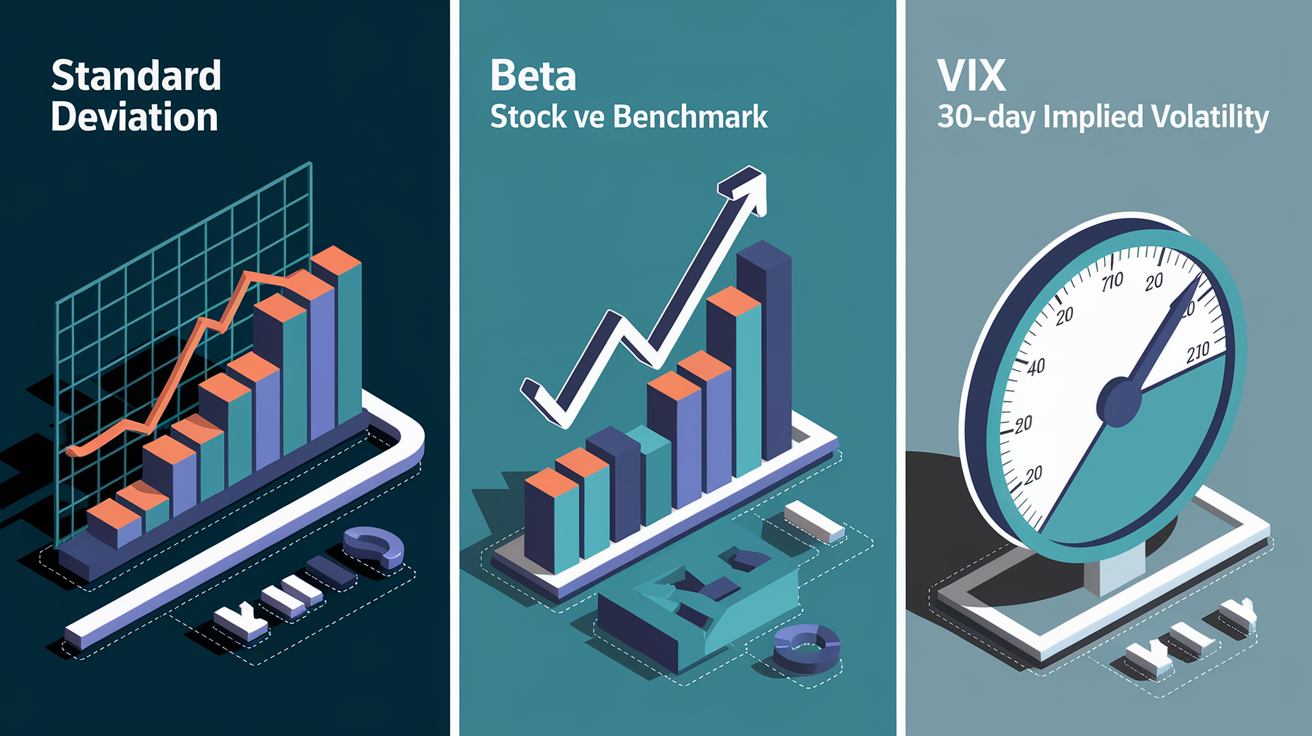
Measuring volatility gives you a numeric grip on risk and helps set expectations for how much a position might swing. The most common approaches fall into three buckets: statistical measures of past price dispersion, relative comparisons to a benchmark, and forward-looking indicators pulled from options markets.
Professional analysts and portfolio managers lean on these methods to size positions, set stop levels, calculate hedging costs, and assess whether current market pricing makes sense relative to history.
Standard Deviation of Returns
Standard deviation quantifies how far individual returns stray from the average return. You calculate daily returns as the percentage change from one close to the next. Plug those daily returns into the standard deviation formula, which squares each deviation from the mean, averages the squared values, and takes the square root.
To annualize daily volatility, multiply the daily standard deviation by the square root of 252 (typical trading days in a year). That factor’s approximately 15.87. So if a stock’s daily standard deviation is 1.5%, its annualized volatility is 1.5% × 15.87, which lands around 23.8%.
Beta as Relative Volatility
Beta measures a stock’s volatility relative to a benchmark, usually the S&P 500. A beta of 1.0 means the stock tends to move in line with the index. Above 1.0 indicates more volatile than the market. Below 1.0 signals lower volatility. A stock with a beta of 1.3 is expected to move 30% more than the index during both rallies and selloffs.
Beta’s useful for portfolio construction. If you want lower overall portfolio volatility, you can tilt toward stocks with betas below 1.0. Aggressive portfolios often hold high-beta names to amplify gains during bull markets, accepting larger drawdowns when the market falls.
VIX as Implied Volatility Benchmark
The CBOE Volatility Index (VIX) reflects the market’s expectation of 30-day volatility for the S&P 500, derived from near-term put and call option prices. The VIX is quoted as an annualized percentage. A VIX reading of 20 means the market expects roughly 20% annual volatility over the next month.
Typical ranges: VIX below 12 signals very low expected volatility and complacency. Readings between 12 and 30 are considered normal to moderate. Above 30 indicates heightened fear and uncertainty. Crisis spikes can push the VIX well above 60. During the March 2020 pandemic selloff, the VIX hit approximately 82.69, the highest level since the 2008 financial crisis.
| Measure | What It Shows |
|---|---|
| Standard Deviation | Historical dispersion of returns, annualized using √252 factor |
| Beta | Volatility relative to benchmark, β = 1.0 matches market |
| VIX | 30-day implied volatility for S&P 500, spikes signal stress |
Practical Examples of Calculating Volatility

Understanding the arithmetic behind volatility helps you translate abstract percentages into dollar and cents price ranges. When someone says a stock has 18% annual volatility, that figure implies a one standard deviation move of roughly ±18% over a year, assuming returns are normally distributed.
Start with a concrete example. Say a stock closes at $100. If its annualized volatility is 18%, one standard deviation suggests the price could land between $82 and $118 over the next twelve months, capturing about 68% of probable outcomes. Two standard deviations (roughly 95% confidence) would span $64 to $136. These ranges help size positions and set realistic expectations.
Here’s the five step process for calculating realized volatility from daily returns:
- Collect daily closing prices for the period you want to analyze (commonly 20, 30, or 60 trading days).
- Calculate daily percentage returns as (Today’s Close − Yesterday’s Close) ÷ Yesterday’s Close.
- Compute the mean (average) of those daily returns to find the center point.
- Measure the standard deviation of the return series using the sample formula: σ = sqrt( (1/(N-1)) × Σ(xi − x̄)² ).
- Annualize the result by multiplying the daily standard deviation by √252 (approximately 15.87).
The table below shows three volatility levels and their corresponding daily standard deviations and one sigma dollar moves on a $100 stock:
| Annual Volatility | Daily σ (approx.) | 1σ Move on $100 Stock |
|---|---|---|
| 5% | 0.32% | ±$0.32 daily, ±$5 annual |
| 18% | 1.13% | ±$1.13 daily, ±$18 annual |
| 35% | 2.20% | ±$2.20 daily, ±$35 annual |
High vs Low Volatility Conditions in the Market

Markets alternate between calm periods when prices drift steadily and turbulent stretches when swings accelerate. Recognizing where the market sits on the volatility spectrum helps you calibrate risk appetite and adjust position sizes.
Historically, the VIX has averaged around 19 to 20 over multi-decade periods. Readings below 12 are rare and typically coincide with extended bull markets, low interest rates, and investor complacency. Levels between 12 and 30 represent normal conditions where day-to-day swings remain manageable. Above 30 signals elevated fear, often triggered by policy uncertainty, geopolitical shocks, or sharp selloffs. Readings above 60 are crisis level stress events.
Common market scenarios that produce volatility shifts include:
Crisis spikes. March 2020 saw the VIX hit roughly 82.69 as pandemic lockdowns crushed global growth expectations and markets dropped nearly 34% in weeks.
2008 to 2009 financial crisis. The S&P 500 fell about 48% from peak to trough. VIX stayed elevated for months.
Low volatility equity benchmarks. Large cap U.S. stocks in sectors like utilities and consumer staples typically show 8 to 12% annualized volatility.
Broad market volatility. The S&P 500 and similar diversified indices usually run 15 to 25% annualized volatility over long periods.
High volatility individual stocks and crypto. Small cap growth names, biotech, and cryptocurrencies often display 40% to over 100% annualized volatility.
Rapid interest rate increases. The 2022 bear market was driven partly by the fastest pace of Fed rate hikes in modern times, pushing the S&P 500 into a drawdown exceeding 20%.
Key Causes Behind Stock Market Volatility

Volatility doesn’t appear randomly. It responds to identifiable economic, political, and structural forces that shift supply, demand, and investor expectations.
Macro drivers are the largest category. Central bank policy decisions, especially unexpected rate hikes or cuts, can swing markets by repricing the cost of future earnings. Inflation data surprises force reassessments of rate paths. Recession signals, such as inverted yield curves or negative GDP prints, trigger risk-off moves. In each case, uncertainty about the future path of growth and rates amplifies price swings.
Company level events also matter. Earnings reports that beat or miss analyst estimates can move individual stocks 5 to 15% in a single session. Revenue guidance revisions, management changes, product recalls, and merger announcements all inject volatility into specific names. Sector wide effects can ripple out when large cap companies surprise.
Market structure and liquidity conditions act as volatility amplifiers. Low trading volumes, especially during holiday periods or overnight sessions, mean smaller orders can move prices more. High amounts of borrowed money in the system, whether from margin debt or derivatives positions, can force rapid unwinds when stop losses trigger. Algorithmic trading and volatility targeting strategies can magnify swings by automatically reducing exposure when realized volatility rises.
| Driver | Description | Typical Market Reaction |
|---|---|---|
| Fed Rate Decisions | Unexpected hikes or cuts shift discount rates for equities | Immediate repricing, VIX often spikes on hawkish surprises |
| Earnings Surprises | Revenue or EPS beats/misses vs consensus | Single stock gap moves, sector rotation if guidance shifts |
| Low Liquidity Periods | Thin order books around holidays or off-hours | Wider bid-ask spreads, exaggerated price swings |
| Geopolitical Events | Wars, sanctions, trade disputes, pandemics | Flight to safety, VIX spikes, correlated selloffs across risk assets |
How Volatility Affects Investors and Portfolios

Volatility shapes both short term portfolio behavior and long run compounding. Higher volatility increases the probability of large drawdowns, which are harder to recover from mathematically. A 50% loss requires a 100% gain just to break even. Frequent large swings also test investor discipline, raising the risk of poorly timed exits.
Diversification offers less protection during volatility spikes than many investors expect. Correlations between stocks, sectors, and even asset classes tend to rise during crises. When the VIX jumps above 40, stocks that normally move independently often sell off together as risk appetite collapses. This correlation surge reduces the benefit of holding multiple positions and can turn a diversified portfolio into a collection of synchronized losers.
Volatility adjusted asset allocation strategies attempt to manage this dynamic by reducing equity exposure when realized or implied volatility climbs above target levels. In theory, this limits drawdowns. In practice, it can also reduce returns if markets rebound quickly after a spike, forcing the strategy to buy back in at higher prices. The trade-off depends on how rapidly volatility mean reverts and whether your time horizon allows for patience.
Five specific outcomes beginners should expect during high volatility periods:
Larger intraday swings. Positions that normally drift 0.5% can move 3 to 5% in hours.
Increased option premiums. Higher implied volatility makes puts and calls more expensive, raising hedging costs.
Portfolio correlation jumps. Stocks, sectors, and sometimes bonds sell off in tandem, reducing diversification benefits.
Forced liquidations. Margin calls and systematic de-risking can push prices below intrinsic value temporarily.
Behavioral stress. Rapid drawdowns trigger fear and can lead to impulsive selling near local lows.
Practical Ways Beginners Can Manage Volatility
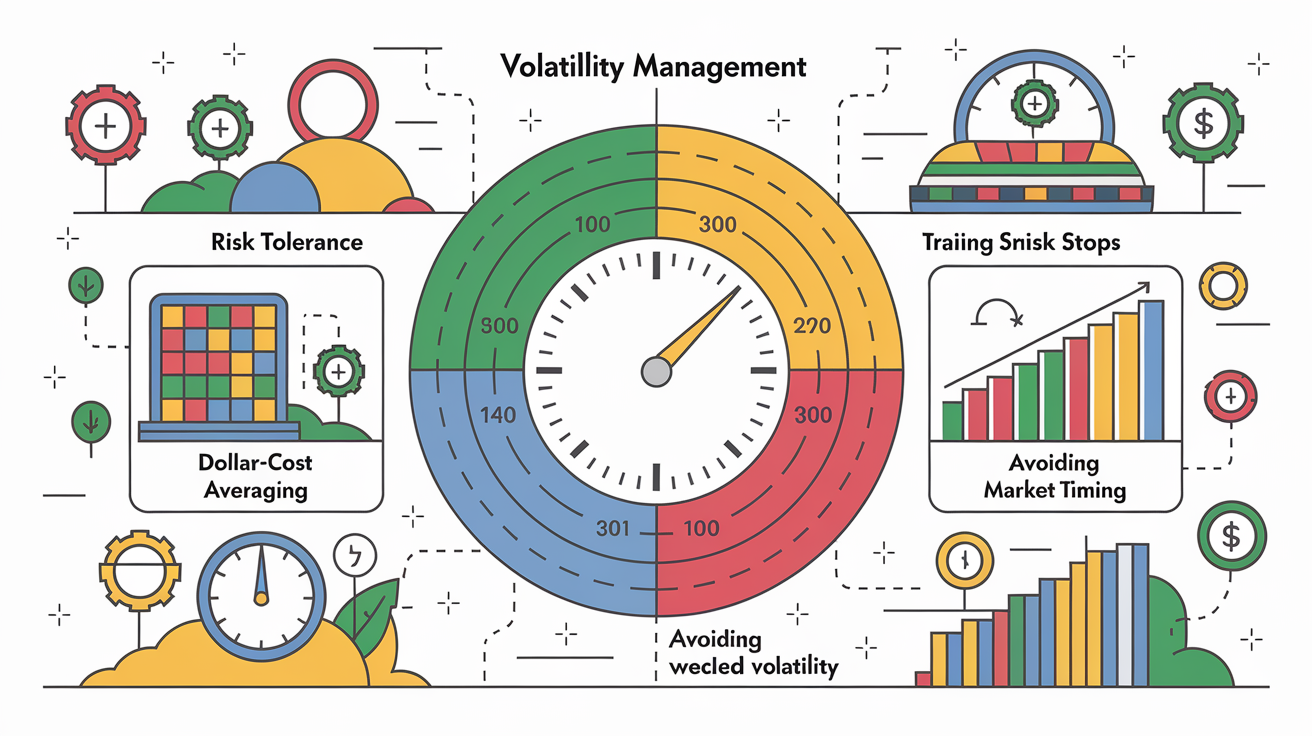
Managing volatility starts with aligning your portfolio to your risk tolerance and time horizon. If you need the money within two years, high volatility stocks are inappropriate regardless of their long term potential. If your horizon is ten years or more, short term swings become noise rather than risk.
Diversification across uncorrelated assets remains the foundation of volatility management. Holding a mix of large cap equities, bonds, real estate, and possibly commodities spreads exposure and reduces the impact of any single sector’s collapse. Rebalancing periodically forces you to sell appreciated, lower volatility positions and buy into higher volatility assets when they’re cheaper, maintaining your target risk profile.
Six actionable techniques for beginners:
Determine your risk tolerance first. Use questionnaires or consult a fiduciary advisor to quantify how much volatility you can stomach before you invest.
Use dollar cost averaging. Invest a fixed dollar amount at regular intervals to smooth entry points and avoid trying to time market lows.
Size positions conservatively. Make sure a three standard deviation move in a single holding won’t force you to liquidate at a loss or disrupt your overall plan.
Set trailing stops or loss limits only if disciplined. Automated stops can protect capital, but also lock in losses during short lived spikes. Know your strategy before using them.
Avoid market timing. Trying to exit before volatility spikes and re-enter after calm returns is statistically difficult even for professionals. Buy and hold often outperforms over full cycles.
Monitor implied vs realized volatility for options. If you trade options, selling volatility (via covered calls or cash secured puts) can be profitable when implied volatility exceeds realized, but requires strict risk management and understanding of tail risk.
Glossary of Essential Volatility Terms
Volatility analysis uses specialized terminology that can confuse beginners. The glossary below defines seven core terms you’ll encounter in research reports, options chains, and risk dashboards.
Realized Volatility (Historical Volatility). The actual observed volatility of an asset over a past period, calculated as the standard deviation of returns. Backward looking and statistical.
Implied Volatility (IV). The market’s expectation of future volatility, derived from current option prices. Forward looking and reflects supply/demand for options, not a prediction of direction.
Volatility Skew. The pattern where out-of-the-money puts trade at higher implied volatility than out-of-the-money calls, reflecting demand for downside protection. Common in equity indexes.
Volatility Smile. A pattern where both out-of-the-money puts and calls have higher implied volatility than at-the-money options. More common in currencies and commodities.
Beta. A measure of a stock’s volatility relative to a benchmark index (usually the S&P 500). Beta of 1.0 matches the index, above 1.0 is more volatile, below 1.0 is less volatile.
VIX (CBOE Volatility Index). The most widely watched gauge of market volatility, reflecting 30-day implied volatility for the S&P 500 derived from option prices. Often called the “fear gauge.”
Maximum Drawdown (MDD). The peak to trough decline in portfolio value during a specific period, expressed as a percentage. Formula is (Trough Value − Peak Value) / Peak Value.
Final Words
Volatility is an active signal — it shows how much prices swing and why that matters for risk and returns.
We covered a plain definition, how to measure swings (standard deviation, beta, VIX), step‑by‑step calculation examples, what drives spikes, how volatility changes portfolios, and simple ways beginners can manage it.
Keep the volatility meaning in stock market front and center when you plan trades or investments. With the right tools and a steady approach, volatility becomes manageable — and useful.
FAQ
Q: Which stocks to buy in 2026?
A: The stocks to buy in 2026 depend on your goals; consider financially healthy firms in AI, energy transition, healthcare, and quality cyclicals with strong earnings, manageable debt, reasonable valuation, and diversified exposure.
Q: What is good volatility for a stock? What does 20% volatility mean?
A: Good volatility for a stock depends on your risk tolerance; 20% annual volatility means the stock’s annualized standard deviation is about 20%, implying roughly 1.26% typical daily moves.
Q: Is high volatility bullish or bearish?
A: High volatility is neither strictly bullish nor bearish; it signals larger price swings and greater uncertainty and can show up during sharp rallies or steep selloffs — context and catalysts set the direction.