


Think market sectors rotate on mood?
They rotate on signals — the hard economic numbers that steer where money flows.
GDP, inflation, jobs, PMIs and the yield curve don’t just make headlines; they change earnings outlooks, financing costs, and which industries win.
This post shows the specific indicators that drive sector rotation, why the links make sense, and action thresholds you can use to tilt a portfolio before the market follows.
Practical, no-frills playbook.
Key Market Signals Behind Sector Rotation Dynamics

Sector rotation happens because investors constantly reprice future earnings based on which industries are about to catch a tailwind. When GDP picks up, cyclical companies see demand surge. Inflation spikes? Commodity producers suddenly have pricing power. Rates drop, and long-duration assets get attractive again.
Portfolio managers watch a core set of indicators every day and every month, trying to figure out where capital’s headed next. They tilt allocations before the rest of the market catches on.
Thresholds matter because they flip institutional positioning and trigger algorithmic rebalancing. Two straight quarters of negative GDP growth? That’s recession risk, and you’ll see flows pour into Healthcare, Consumer Staples, and Utilities. Year-over-year CPI sitting above 3 percent for a while typically means late-cycle inflation pressure, pushing capital toward Energy and Materials while hammering long-duration Growth names. Unemployment creeping toward 6 or 7 percent warns of contraction risk. Drop it to 4 or 5 percent and you’re looking at a tight labor market and late-cycle dynamics. Manufacturing PMI above 50 means expansion. Below 50 signals contraction and triggers underweights in cyclicals. The Fed adjusts rates in 25 to 75 basis point chunks, and every hike reshapes which sectors win by changing financing costs, net interest margins, and how the market values future cash flows.
These indicators marked turning points in 2009, 2020, and 2022, driving sharp rotations from defensives to cyclicals, growth to value, and back again.
The top actionable indicators investors track include:
- Real GDP growth: quarterly releases confirm expansion or contraction and set the foundation for cyclical vs defensive positioning.
- CPI and PCE inflation: monthly prints above or below the Fed’s 2 percent target drive commodity and rate-sensitive sector tilts.
- Unemployment rate and initial jobless claims: weekly claims and monthly payrolls signal labor-market tightness and recession risk.
- ISM Manufacturing and Services PMIs: monthly readings above or below 50 confirm the direction of economic activity.
- Federal funds rate changes: 25 to 75 bps hikes or cuts reshape financing costs and net interest margins across sectors.
- 2-year vs 10-year Treasury spread: inversion (2s–10s negative) historically warns of recession and defensive rotation ahead.
How Economic Cycle Phases Shape Rotation Patterns

Economic cycles move through distinct phases, and sector leadership rotates pretty predictably as the cycle rolls forward. Early recovery starts when GDP turns positive after a trough, unemployment peaks and begins to fall, and PMIs cross back above 50. Investors overweight Industrials, Consumer Discretionary, and Materials because these cyclical sectors benefit first from rising capacity utilization, restocking, and consumer spending coming back to life.
Mid-expansion brings strong GDP growth, moderate inflation, and tightening labor markets. Technology and Financials tend to lead as corporate investment accelerates and credit demand rises. Late-cycle expansion shows up when inflation pressures build, the Fed tightens policy, and the yield curve flattens or inverts. Energy and Materials outperform on commodity price strength, while defensive allocations to Healthcare and Consumer Staples rise as recession risk increases.
During recession, GDP contracts, PMIs fall below 50, and unemployment climbs. Healthcare, Consumer Staples, and Utilities outperform because their revenues aren’t as sensitive to economic downturns.
The 2-year vs 10-year Treasury spread is a critical cycle-stage indicator. A steep, positive curve (10s yielding way more than 2s) typically accompanies early to mid expansion, supporting cyclical risk-taking. When the curve flattens and inverts (2-year yields exceed 10-year yields), history shows recession often follows within 12 to 24 months, triggering defensive sector rotations. Institutional investors monitor the inversion duration. An inversion persisting longer than three months historically raises the probability of shifting allocations away from cyclicals by 10 to 20 percent.
Indicators That Confirm Each Cycle Stage
GDP prints verify whether the economy’s expanding or contracting. Two consecutive negative quarters confirm recession, while positive sequential growth confirms recovery or expansion. PMIs offer higher-frequency confirmation: a reading above 50 signals that manufacturing or services activity is expanding, while below 50 indicates contraction.
Unemployment data lags the cycle but confirms its stage. Rising unemployment reinforces recessionary positioning, while falling unemployment and strong payroll gains confirm mid-expansion. Inflation readings from CPI and PCE distinguish mid-cycle (inflation near target, growth strong) from late-cycle (inflation accelerating, Fed tightening) dynamics.
The yield curve synthesizes market expectations for growth and policy. Steepening curves suggest recovery or expansion ahead, while inversions price in slowing growth and potential recession. Together, these indicators let investors classify the current regime and anticipate the next phase before it becomes consensus.
Indicator-to-Sector Relationships and Why They Matter

Each economic indicator exerts direct mechanical effects on sector cash flows, valuations, and relative performance. Rising interest rates increase banks’ net interest margins, making Financials more profitable as they earn a wider spread between deposits and loans. Falling rates reduce financing costs for capital-intensive businesses and make dividend yields on Utilities and REITs more attractive relative to Treasury yields, pulling capital into those rate-sensitive sectors.
Strong GDP growth and PMIs above 50 expand demand for industrial goods, consumer purchases, and raw materials, driving earnings in Industrials, Consumer Discretionary, and Materials. High CPI readings boost commodity prices and input costs, directly benefiting Energy and Materials producers who sell at higher prices, while squeezing margins for consumer-facing companies.
Widening credit spreads (measured as the option-adjusted spread on investment-grade or high-yield bonds) signal rising default risk and deteriorating financial conditions, triggering defensive rotations into Healthcare, Staples, and Utilities as investors de-risk. When crude oil prices jump more than 10 percent month-over-month, Energy sector earnings estimates rise and capital flows shift accordingly. Disinflation or falling inflation helps long-duration Growth stocks because lower rates reduce the discount applied to distant future cash flows, making Technology and other growth-oriented names more valuable.
These relationships create a repeatable playbook:
- Rate hikes favor Financials early in the tightening cycle because wider spreads offset modest credit deterioration. Once recession risk rises, Financials underperform.
- Rate cuts favor Technology, REITs, and Utilities by lowering discount rates and making bond-like dividend yields more competitive.
- Positive GDP surprises and rising PMIs tilt portfolios toward Industrials, Discretionary, and Materials as cyclical demand accelerates.
- CPI spikes above 3 percent for multiple months shift flows to Energy and Materials because they’re natural inflation hedges. Long-duration Growth underperforms.
- Credit spread widening above historical norms triggers defensive rotations into Healthcare and Staples, signaling risk-off positioning ahead of potential downturn.
| Indicator | Likely Sector Tilt |
|---|---|
| Rising interest rates (25–75 bps hike) | Overweight Financials; underweight Utilities, REITs, long-duration Growth |
| CPI >3% YoY for 3+ months | Overweight Energy and Materials; reduce Technology and Discretionary |
| PMI >50 with accelerating GDP | Overweight Industrials, Consumer Discretionary, Materials |
Historical Market Rotations Driven by Economic Indicators
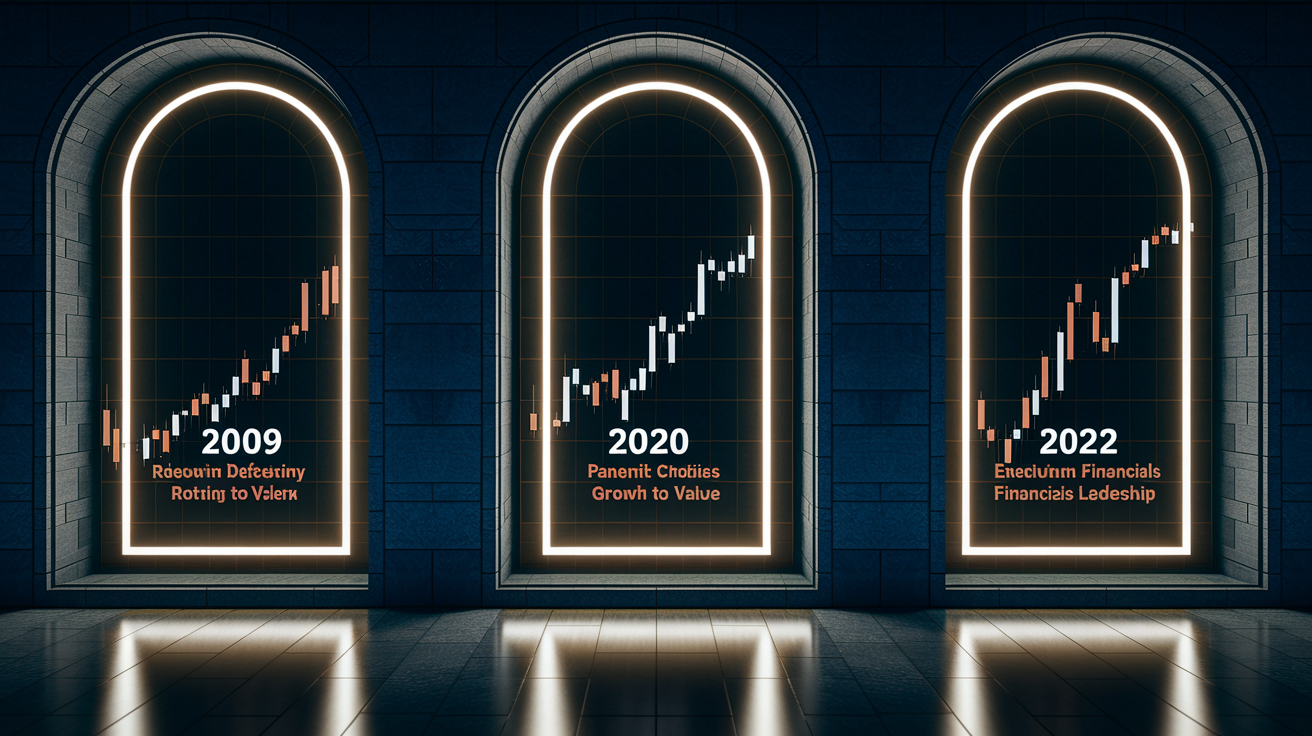
The post-Great Financial Crisis recovery is a textbook example of indicator-driven rotation. The S&P 500 bottomed on March 9, 2009, and over the following quarters GDP turned positive, unemployment peaked near 10 percent in late 2009 and began a multi-year decline, and manufacturing PMIs crossed back above 50.
Cyclical sectors (Financials, Industrials, and Consumer Discretionary) outperformed defensive sectors through 2009 and 2010 as investors repriced the probability of sustained expansion. Banks benefited from recapitalization and wider lending spreads as the Fed held rates near zero, while industrial production rebounded from trough levels. The rotation was driven by sequential improvements in GDP prints, falling initial jobless claims, and rising consumer confidence, all confirming the early-recovery playbook.
The COVID-19 crash and recovery show how quickly macro signals can shift sector leadership. Equity markets peaked in mid-February 2020, and the S&P 500 fell more than 30 percent into a trough on March 23, 2020. Technology led the initial recovery into the second half of 2020 because stay-at-home demand, zero rates, and Fed liquidity favored long-duration growth.
As vaccines rolled out and PMIs rebounded sharply above 50 in mid-2020, cyclical sectors (Industrials, Materials, Financials) began outperforming into 2021 as economic reopening drove demand for travel, construction, and goods. The rotation pivot occurred when GDP turned positive, unemployment began falling from the April 2020 peak near 15 percent, and manufacturing data confirmed expansion rather than collapse.
The 2022 tightening cycle marked a sharp reversal from growth to value and from long-duration to rate-beneficiaries. The Federal Reserve delivered its first 25 basis point rate hike on March 16, 2022, initiating a multi-meeting cycle of increases aimed at curbing inflation that had reached four-decade highs. Energy and Financials outperformed the broader market through 2022 as oil prices spiked on supply constraints and banks earned wider net interest margins. Technology and other long-duration growth names underperformed because rising rates increased the discount on future cash flows and CPI remaining above 3 percent sustained inflationary pressure.
The rotation was telegraphed by consecutive CPI prints above target, Fed commentary signaling a hawkish path, and the 2s–10s yield curve flattening then inverting by mid-2022, all indicating late-cycle conditions and recession risk ahead.
Practical Rotation Framework Using Economic Indicators

A repeatable rotation framework starts with a top-down macro assessment, layering economic-cycle indicators to classify the current regime, then applying tactical rules to tilt sector weights. Investors monitor high-frequency market signals daily (Treasury yields, credit spreads, sector performance) and macroeconomic releases weekly or monthly to confirm the cycle stage.
The framework prioritizes leading indicators like PMIs, jobless claims, and the yield curve because they turn ahead of lagging data such as GDP, allowing earlier positioning changes. Confirmation from at least two independent indicators reduces false signals. For example, a single weak PMI print may not trigger a rotation, but PMI below 50 combined with rising jobless claims and an inverted yield curve provides stronger evidence of contraction risk.
Tactical trigger thresholds translate indicator moves into position adjustments. Two consecutive quarters of negative GDP growth signal recession and justify shifting 70 to 100 percent of tactical exposure toward defensive sectors (Healthcare, Consumer Staples, Utilities). A 2s–10s yield curve inversion persisting longer than three months historically precedes recession within 12 to 24 months, prompting a 10 to 20 percent reduction in cyclical exposure.
When year-over-year CPI remains above 3 percent for three consecutive months, investors increase Energy and Materials allocations by 5 to 10 percent to hedge inflation and capture commodity price momentum. Initial jobless claims spiking more than 20 percent above the four-week moving average warns of labor-market deterioration and tightens overall risk exposure. Each trigger carries a rebalancing rule: confirm the signal over multiple weeks or months, adjust positions incrementally rather than all-or-nothing, and cap total active sector bets to avoid concentration risk.
The implementation process follows six steps:
- Classify the cycle stage using GDP, PMIs, unemployment, inflation, and the yield curve to determine early recovery, mid-expansion, late cycle, or recession.
- Identify sector leaders for the current phase based on historical performance patterns and cash-flow sensitivity to the dominant macro drivers.
- Monitor trigger thresholds daily and weekly for rate changes, credit spreads, jobless claims, and commodity prices. Monthly for CPI, PMI, and GDP.
- Confirm signals with at least two independent indicators before making material allocation changes to reduce whipsaw from single-data noise.
- Tilt sector weights incrementally by 5 to 15 percent overweight or underweight relative to benchmark, rebalancing as new data confirms or refutes the thesis.
- Apply risk controls including stop-losses, take-profit rules, and position-size limits to cap downside if the rotation stalls or reverses.
For deeper context on how policy shifts and central-bank guidance interact with these indicators, reference Sector Rotation Explained Via Macro Factors & Policy Backdrop to understand macro-policy timing models.
Cross-Asset Indicators That Strengthen Sector Rotation Signals

Cross-asset price movements often lead equity sector rotations because commodities, credit, and currencies react faster to changing macro expectations. Copper prices serve as an economic bellwether. Rising copper signals industrial demand strength and supports overweights in Industrials and Materials, while falling copper warns of slowing manufacturing and cyclical weakness.
Gold flows capture safe-haven demand. Sustained gold rallies alongside falling real yields indicate risk aversion and foreshadow defensive sector strength in Healthcare, Staples, and Utilities. Credit spreads, particularly high-yield option-adjusted spreads, widen when default risk rises and financial conditions tighten, offering an early warning that equity investors should reduce cyclical exposure and add defensives.
Market liquidity measures (such as bid-ask spreads, trading volumes, and repo rates) deteriorate ahead of stress events. Liquidity crunches historically precede late-cycle rotations and defensive positioning.
Oil price momentum directly impacts Energy sector performance and indirectly signals inflation and cyclical demand. A month-over-month oil gain exceeding 10 percent often triggers tactical tilts into Energy and Materials while raising CPI forecasts that pressure long-duration Growth. Volatility spikes in equity indices (VIX) and credit markets confirm late-cycle risk. Sustained VIX above 20 or rapid VIX increases accompany defensive rotations as investors de-risk.
Currency moves, especially U.S. dollar strength or weakness, affect exporters and commodity prices. Dollar strength pressures Materials and Energy while favoring domestic-focused sectors like Utilities and Staples.
The strongest cross-asset tells include:
- Copper price direction: rising copper confirms cyclical strength. Falling copper warns of industrial slowdown and supports defensive tilts.
- Gold rallies with falling real yields: signals risk-off sentiment and foreshadows Healthcare, Staples, and Utilities outperformance.
- Credit spread widening (investment-grade or high-yield OAS): warns of financial stress and triggers rotation toward defensives before equity weakness materializes.
- Liquidity deterioration (wider bid-asks, falling volumes, rising repo rates): precedes market dislocations and justifies reducing cyclical exposure and raising cash or defensive holdings.
Data Quality, Caveats, and Monitoring Risks in Sector Rotation

Indicator-driven rotation strategies face multiple data and execution risks that can erode performance. Market data feeds often carry latency of at least 15 minutes, and prices sourced from over-the-counter brokers or market makers may differ from official exchange quotes, introducing slippage and execution uncertainty. Redistribution of proprietary data is typically restricted, limiting the ability to validate signals across independent sources.
False signals occur when a single indicator prints an outlier (such as a one-month CPI spike driven by temporary supply shocks), triggering premature rotations that reverse when subsequent data normalizes. Relying on a single data source or indicator without cross-confirmation amplifies the risk of acting on noise rather than signal.
Policy uncertainty and geopolitical shocks can override traditional indicator relationships. Fiscal stimulus announcements, unexpected central-bank interventions, or geopolitical crises can trigger rotations that contradict economic-cycle patterns. For example, defensives underperforming during a recession if massive fiscal support props up cyclical demand.
Supply-chain disruptions and structural shifts (such as energy transitions or deglobalization) can decouple historical sector-indicator correlations, making backtested rotation models less reliable. Quantitative easing and quantitative tightening alter liquidity conditions and asset correlations in ways that pure economic indicators don’t capture, requiring investors to layer central-bank balance-sheet analysis on top of GDP, inflation, and employment data.
For a detailed discussion of why multiple indicator sources and cross-validation are critical, see Top Sector Rotation Indicators from Index APIs, which describes data-sourcing challenges and the need for robust confirmation workflows.
Key caveats to monitor include:
- Data latency and OTC pricing differences can cause execution slippage. Always validate live prices against exchange feeds before large trades.
- Single-indicator noise: require confirmation from at least two independent macro signals (e.g., PMI + jobless claims or CPI + credit spreads) before rotating material capital.
- Policy and geopolitical overrides: fiscal stimulus, central-bank interventions, and geopolitical events can temporarily break indicator-sector correlations, demanding manual judgment overlays.
- Structural regime shifts: supply-chain changes, energy transitions, and deglobalization may alter historical relationships, so backtest performance isn’t a guarantee of future results.
Tools and ETF Structures That Implement Indicator-Based Sector Rotation
Sector rotation ETFs automate the process of tilting exposure based on economic and technical signals, offering retail and institutional investors a turnkey way to execute macro-driven strategies. The Anfield US Equity Sector Rotation ETF (AESR), ATAC US Rotation ETF (RORO), First Trust Lunt US Factor Rotation ETF (FCTR), Main Sector Rotation ETF (SECT), SPDR SSGA Fixed Income Sector Rotation ETF (FISR), and SPDR SSGA US Sector Rotation ETF (XLSR) each apply quantitative models that combine macro indicators, momentum factors, and relative-strength measures to rebalance holdings monthly or quarterly. These funds handle the monitoring, signal confirmation, and rebalancing mechanics, reducing the operational burden on investors who lack the infrastructure to track dozens of indicators in real time.
Value versus growth rotation patterns provide another tactical layer. The iShares Russell 1000 Value ETF (IWD) and iShares Russell 1000 Growth ETF (IWF) serve as liquid instruments for expressing cycle-stage views. Value outperforms when rates rise and the economy accelerates, while growth leads when rates fall and long-duration assets re-rate higher.
Technical indicators embedded in rotation strategies include the Relative Strength Index (RSI), where readings at or below 30 signal oversold conditions and potential rotation entry points, and readings above 70 indicate overbought conditions and rotation exits. The 200-day simple moving average acts as dynamic support or resistance, with sustained moves above or below the 200-day SMA confirming trend direction and sector leadership changes.
Heatmaps, flow data, and automated screens support real-time rotation decisions. Sector performance heatmaps visualize relative strength across the 11 sectors, highlighting which groups are leading or lagging intraday and over trailing periods. ETF inflow and outflow tracking reveals institutional positioning changes. Sustained inflows into defensive sector ETFs (XLP, XLV, XLU) signal rotation toward safety, while cyclical ETF inflows (XLI, XLY, XLB) confirm risk-on sentiment. Alerts configured around indicator thresholds (such as PMI crossing 50, CPI exceeding 3 percent, or the 2s–10s curve inverting) trigger review workflows and prompt tactical adjustments before consensus shifts.
For practical guidance on applying these tools, consult Your Complete Guide to Sector Rotation, which describes ETF selection, technical trigger rules, and rotation implementation workflows.
Practical tools that support indicator-based rotation include:
- Sector rotation ETFs (AESR, RORO, FCTR, SECT, XLSR): automate rule-based tilts, rebalancing monthly or quarterly based on macro and momentum signals.
- Value/Growth ETFs (IWD, IWF): liquid vehicles for expressing cycle-stage views and relative-performance bets.
- RSI and moving-average screens: RSI ≤30 flags oversold entry points. RSI >70 signals overbought exits. 200-day SMA confirms trend direction.
- Sector heatmaps and flow trackers: visualize real-time leadership and institutional positioning shifts across sectors.
- Automated alerts on thresholds: trigger reviews when PMI crosses 50, CPI exceeds 3 percent, yield curve inverts, or jobless claims spike, ensuring timely tactical adjustments.
Final Words
We mapped the macro signals that move sector leadership — GDP thresholds, CPI/PCE, unemployment, PMI, and Fed rate shifts — and showed how investors watch them to time rotations.
You saw the cycle map (early recovery to late cycle), the indicator-to-sector mechanics, cross-asset confirms, and rules you can use in practice.
Apply the framework and keep a simple checklist. Economic indicators that drive sector rotation are tools, not noise — stay systematic and the approach will help you act with more confidence.
FAQ
Q: What are the 10 leading economic indicators?
A: The 10 leading economic indicators are average weekly manufacturing hours, initial unemployment claims, manufacturers’ new orders (consumer goods/materials), vendor performance, nondefense capital goods orders, building permits, stock prices, M2 money supply, the term spread (10y–Fed funds), and consumer expectations.
Q: What is the 7% rule in stocks?
A: The 7% rule in stocks refers to a simple risk‑management guideline where investors set a 7% stop‑loss or profit‑taking threshold; it’s a rough heuristic, not a one‑size‑fits‑all rule.
Q: Who owns 88% of the stock market in the USA?
A: About 88% of the U.S. stock market is owned by the wealthiest 10% of households, alongside large institutional investors; the top decile holds the bulk of household equity wealth.
Q: Where is money safest during a recession?
A: Money is safest during a recession in short‑term U.S. Treasuries, cash and money‑market funds, and FDIC‑insured bank accounts; high‑quality short bonds and defensive assets also help preserve capital.