

Think the market sleeps after 4:00 pm? Think again.
After-hours stock market futures run nearly nonstop and give a real-time read on sentiment long before most traders wake up.
This post shows which contracts matter (ES, NQ, YM and their micro siblings), how to translate point moves into dollars and implied opens, and which signals—VIX futures, pre-market volume, and breadth—confirm overnight bias.
Read on to use overnight price action to size trades, manage risk, and set sharper plans for the next-day open.
Understanding After-Hours Futures Activity and Its Impact on Next-Day Markets

After-hours stock market futures give you a continuous read on sentiment long after the cash session closes at 4:00 pm ET. Individual stocks might trade until 8:00 pm on retail platforms, but major index futures like the E-mini S&P 500 (ES), E-mini Nasdaq-100 (NQ), and E-mini Dow (YM) run almost nonstop on CME Globex. They kick off Sunday at 6:00 pm ET and don’t stop until Friday at 5:00 pm ET, except for a quick maintenance break from 5:00 to 6:00 pm each weekday. This means futures digest overnight news, earnings, data prints, and global events before most U.S. investors even check their phones.
Futures contracts use dollar multipliers that turn index-point moves into actual money. ES has a $50 multiplier with a minimum tick of 0.25 points (worth $12.50). NQ uses $20 per point, same 0.25-point tick ($5.00). YM runs a $5 multiplier with 1-point ticks ($5.00 each). When ES climbs 10 points overnight, one long contract gains $500 (10 × $50), and that 10-point jump suggests the S&P 500 will open roughly 10 points higher, depending on fair-value tweaks and opening auction behavior.
Traders lean on overnight futures to read directional bias and set up before the 9:30 am bell. Futures pull institutional flow and global hedging traffic, so their moves often beat thinly traded after-hours stock prints as sentiment signals. Still, liquidity stays thinner than during regular hours, and big reversals can hit once full cash-market flow arrives.
Signals traders track overnight:
- Point change in ES, NQ, and YM – instant snapshot of broad market direction
- VIX futures movement – climbing VIX futures usually mean risk-off sentiment and expanding volatility
- Pre-market volume – unusual spikes can confirm or challenge the overnight move
- Economic calendar – 8:30 am ET data (jobs, CPI, retail sales) can flip futures before the cash open
Trading Hours Breakdown for After-Hours Markets and Overnight Futures

Cash equity markets run 9:30 am to 4:00 pm ET on weekdays. Many brokers stretch that with pre-market access starting around 4:00 am and after-hours continuing until 8:00 pm, though exact windows vary by broker and routing network. The Toronto Stock Exchange skips pre-market but offers a post-trade window from 4:15 to 5:00 pm ET. These extended equity hours deliver limited liquidity through electronic communication networks, meaning fewer participants and wider spreads.
Index futures on CME Globex follow a nearly continuous clock. Trading starts Sunday at 6:00 pm ET and rolls through Friday at 5:00 pm ET, stopping only for a 60-minute daily maintenance window from 5:00 to 6:00 pm each weekday. This around-the-clock setup lets global traders react to overnight headlines, central-bank moves, and earnings dropped outside U.S. hours. The maintenance break is the only hard stop, so you either close or roll positions before that window or sit tight until it reopens.
| Session | Hours (ET) | Notes |
|---|---|---|
| Cash equity after-hours | 4:00 pm – 8:00 pm (typical) | Broker-dependent; ECN routing; limit orders only |
| Futures overnight (CME Globex) | Sunday 6:00 pm – Friday 5:00 pm | Daily 5:00–6:00 pm maintenance break |
| Maintenance window | 5:00 pm – 6:00 pm daily | No trading; systems update and settle |
Key Index Futures to Track During After-Hours Moves

The E-mini S&P 500 (ES), E-mini Nasdaq-100 (NQ), E-mini Dow (YM), and their Micro siblings dominate overnight price discovery. Each contract has its own multipliers and tick sizes that decide how much a single index-point move costs or pays in actual dollars. You need to know these specs if you’re sizing positions or trying to read overnight moves.
E-mini S&P 500 (ES)
ES tracks the S&P 500 with a $50 multiplier per point. Minimum tick is 0.25 points, making each tick worth $12.50. A 10-point overnight rally equals $500 per contract (10 × $50) and implies the S&P 500 will open about 10 points higher. ES is the most liquid equity futures contract, used by institutions for hedging and by retail traders for directional bets.
E-mini Nasdaq-100 (NQ)
NQ follows the Nasdaq-100 with a $20 multiplier. Minimum tick is 0.25 points, worth $5.00. A 20-point move equals $400 per contract (20 × $20). Because the Nasdaq-100 leans heavily tech, overnight NQ moves often echo sentiment around mega-cap earnings or semiconductor releases. Watching NQ alongside ES can reveal sector rotation or divergence.
E-mini Dow (YM)
YM tracks the Dow Jones Industrial Average with a $5 multiplier and 1-point minimum tick worth $5.00. A 50-point overnight shift equals $250 per contract (50 × $5). YM tends to be less volatile in percentage terms than NQ but can post big absolute-point swings. Since the Dow is price-weighted, moves in high-priced names like UnitedHealth or Goldman Sachs can skew YM disproportionately.
Micro E-mini Contracts (MES, MNQ, MYM)
Micro E-mini S&P (MES) uses a $5 multiplier with a 0.25-point tick worth $1.25. A 10-point move in MES equals $50 per contract (10 × $5). Micro contracts let smaller accounts tap overnight futures with one-tenth the exposure of standard E-minis. Micro Nasdaq (MNQ) and Micro Dow (MYM) follow the same 1:10 scaling. These are useful for risk management, strategy testing, and grabbing overnight exposure without tying up large margin.
| Symbol | Multiplier | Tick (points) | Tick Value ($) |
|---|---|---|---|
| ES | $50 | 0.25 | $12.50 |
| NQ | $20 | 0.25 | $5.00 |
| YM | $5 | 1.00 | $5.00 |
| MES | $5 | 0.25 | $1.25 |
How After-Hours Futures Predict Market Sentiment and Implied Opens

Overnight futures work as real-time pricing tools for expected cash-index levels at the next open. When a major earnings miss drops at 4:05 pm ET or a central bank surprises with a rate decision at 2:00 am ET, futures absorb it immediately. You can use the overnight futures settlement price and current futures price to estimate an “implied open” for the S&P 500, Nasdaq-100, or Dow.
The basic math is simple: if ES futures climb 12.75 points overnight, the S&P 500 cash index should open roughly 12.75 points higher than its prior 4:00 pm close, assuming no fair-value tweak. In dollars, a long ES contract would show an unrealized gain of 12.75 × $50 = $637.50. You then decide whether to hold that exposure into the open or lock in profits before the cash session adds liquidity and maybe reverses.
Fair-value adjustments complicate the straight point-for-point read. Futures prices bake in cost-of-carry: interest rates on the notional minus expected dividends until expiration. When rates rise or a big dividend nears, the gap between futures and cash can widen. Professional desks calculate fair value by adding or subtracting this basis to the prior cash close, then comparing current futures to fair value. If futures trade above fair value, the market is “rich” and may gap up more than the raw futures move. Below fair value means “cheap,” and the open gap may be smaller.
Steps you can use to read implied opens from overnight futures:
- Note the prior cash-index close – record the S&P 500, Nasdaq-100, or Dow level at 4:00 pm ET.
- Check the current futures price – pull up ES, NQ, or YM on a live feed during overnight hours.
- Calculate the point change – subtract the prior settlement futures price from the current price.
- Apply fair-value adjustment if you have it – many terminals show “fair value” or “futures premium/discount.”
- Estimate the implied cash open – add the adjusted point change to the prior cash close to get an approximate opening level.
Indicators Traders Use When Analyzing After-Hours Futures

Beyond raw futures point changes, you want extra signals to confirm or question overnight moves. VIX futures give you a forward look at expected volatility. When VIX futures climb overnight, it often signals rising hedging demand and risk-off mood, even if ES futures are only slightly lower. Falling VIX futures alongside rising ES suggest calm, grind-higher conditions.
Pre-market volume and advance-decline data offer breadth confirmation. If ES is up 8 points but pre-market volume is unusually light and only a handful of stocks are trading above their prior close, the move might lack conviction. Heavy pre-market volume with a strong advance-decline ratio backs the directional bias. You also want to watch sector leadership in pre-market: if tech stocks dominate the advance list, NQ should beat ES. If financials and industrials lead, YM may show relative strength.
Indicators worth tracking when reading overnight futures:
- VIX futures direction and term structure – rising VIX futures often come before volatile opens and risk-off mood
- Pre-market volume leaders – stocks with unusual overnight volume show where news or earnings are pulling flow
- Advance/decline delta in pre-market – net breadth confirms or fights the index futures move
- Overnight economic data releases – scheduled prints at 8:30 am ET (jobs, CPI, retail sales) can flip earlier futures signals
- Correlation checks between ES, NQ, and YM – divergence between indices may point to sector rotation or index-specific news
Accessing Live After-Hours Futures Quotes and Charts

Real-time futures data comes through exchange feeds, professional terminals, and retail brokerage platforms. CME Group publishes official contract specs, settlement times, and volume data. Many charting platforms offer continuous futures charts that splice front-month contracts together, letting you see overnight price action alongside regular-session candles. Real-time quotes usually need a paid data subscription or an active brokerage account with futures permissions.
Delayed quotes (usually 10 to 15 minutes behind) are free on many financial sites and work fine for casual monitoring. But if you’re executing overnight positions, you need real-time tick data and Level II depth to judge liquidity and dodge wide spreads. Some platforms overlay pre-market equity volume and time-and-sales data, so you can see both futures and individual stock activity in one view.
Platform types for live after-hours futures access:
- Exchange data feeds – direct CME or ICE market data subscriptions for lowest latency
- Professional terminals – Bloomberg, Refinitiv, FactSet bundle futures, options, and cash-equity data
- Retail charting platforms – TradingView, NinjaTrader, ThinkorSwim offer continuous futures charts and customizable session overlays
- Brokerage platforms with extended hours – Interactive Brokers, TD Ameritrade, Schwab, Fidelity give real-time futures quotes and pre-market equity data to account holders
Order Execution Mechanics and Liquidity Challenges in After-Hours Futures

Overnight futures sessions carry less participation than daytime trading, and that thinner order book means wider bid-ask spreads and more slippage risk. A market order at 2:00 am ET might execute several ticks away from the last quoted price, costing more than you planned. Limit orders protect against bad fills by setting the worst acceptable price, but they risk staying unfilled if the market moves away.
Stop orders and stop-limit orders face execution uncertainty overnight. A stop-market order can trigger on a quick liquidity spike and fill at a bad price before reverting. Stop-limit orders may never fill if the market gaps through your limit. Traders holding overnight positions often use mental stops or alerts instead of resting stop orders to avoid getting swept out by low-volume spikes.
The daily CME maintenance window from 5:00 to 6:00 pm ET halts all trading and cancels resting orders. Your positions stay open, but you can’t adjust or exit during that hour. If you need to manage risk across the maintenance break, you either close before 5:00 pm ET or wait until 6:00 pm ET to put orders back in.
Limit Orders After Hours
Limit orders are the safest execution tool in low-liquidity sessions. By setting a max buy price or min sell price, you control slippage and avoid chasing a thin order book. The trade-off is execution risk: if your limit is too tight, the market may blow past your order and leave you flat when you wanted exposure. Successful overnight traders set limits slightly inside the current bid or offer to improve fill odds while still guarding against wide spreads.
Market/Stop Order Risks
Market orders guarantee execution but not price. In overnight hours, one large order can move the market several ticks, and your fill may land far from the last quote. Stop-market orders can trigger on brief volatility spikes (sometimes called “stop hunts”) and fill at poor levels before the market snaps back. Stop-limit orders add a second layer: the stop triggers the order, but it only fills if the market hits your limit price. If the market gaps through that limit, you stay in the position. For overnight risk management, many traders prefer alerts that let them manually decide execution rather than relying on automatic stops.
Risk Management for Overnight Futures Positions
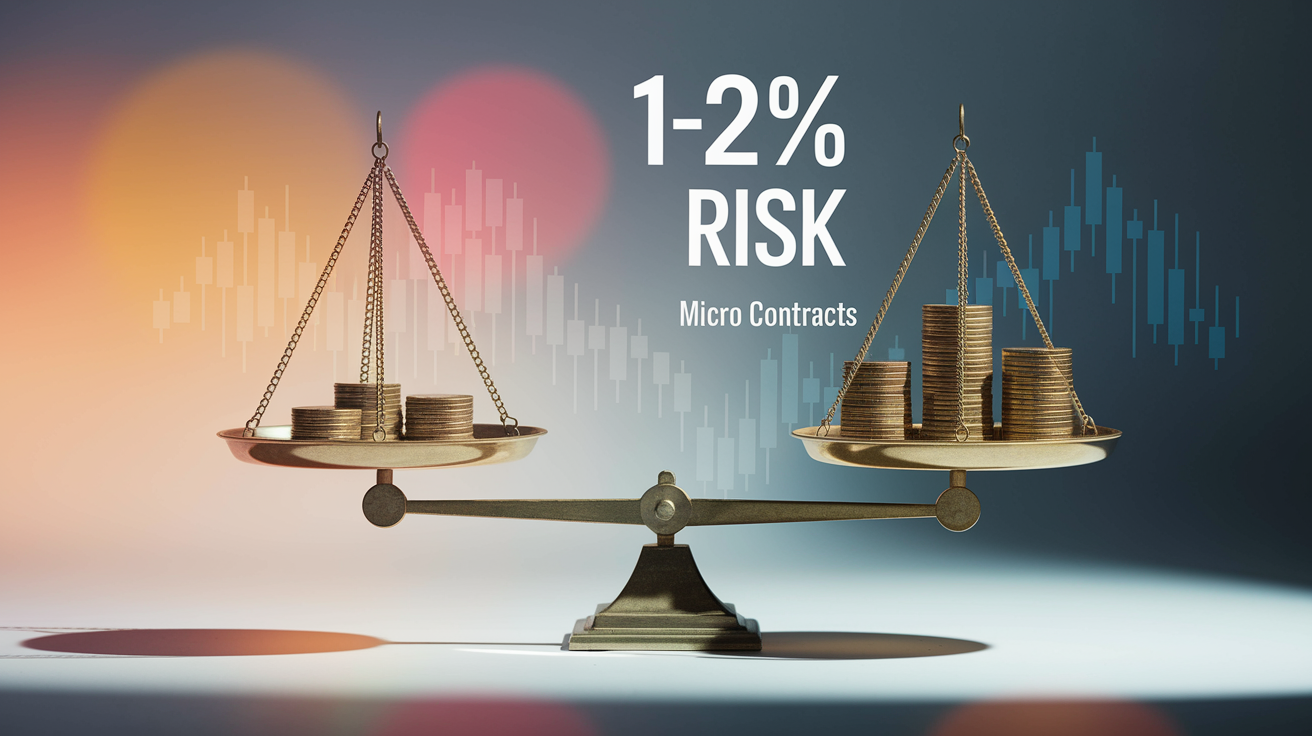
Overnight holding exposes you to gap risk: the market can jump sharply at the open because of news that hit after your entry. Position sizing becomes critical. Each ES contract carries $50 per point, so a 20-point adverse overnight move costs $1,000 per contract. Most traders risk only 1 to 2 percent of account equity per trade, which means calculating the max allowable point move and dividing by the contract multiplier to find position size.
Micro contracts cut notional exposure by a factor of ten. If your risk budget allows one ES contract but you want to test a strategy or hold a smaller position, five MES contracts give you half the exposure (5 × $5 = $25 per point versus $50 per point for one ES). Diversifying across ES, NQ, and YM can spread sector and index risk, though correlation between the three runs high during broad market moves.
Hedging with options on futures or VIX futures can offset overnight gap risk. Buying a small out-of-the-money put on ES before holding a long futures position overnight caps downside if news breaks against you. Or you can monitor VIX futures: if VIX spikes overnight, it often signals that ES will gap lower, giving you an early warning to exit or hedge.
Actionable overnight risk controls:
- Calculate dollar risk per point – know your contract multiplier and multiply by the max adverse move you can handle.
- Size positions to account equity – risk 1 to 2 percent per trade; divide total risk dollars by dollars per point to find contract quantity.
- Use Micro contracts for smaller exposure – MES, MNQ, MYM let you hold fractional E-mini size and test strategies with less capital at risk.
- Set alerts rather than resting stops – avoid automatic stop-outs during low-liquidity spikes; manually assess before exiting.
- Monitor the economic calendar – knowing the schedule prevents surprise data prints from catching you overexposed overnight.
Examples Showing How Overnight Futures Moves Translate to Real Market Impact
Concrete scenarios help show how futures point changes turn into profit, loss, and expected cash-index opens. Each example uses typical contract specs and assumes no unusual fair-value tweaks.
Bullish Overnight Move
Prior S&P 500 cash close: 4,500.00. At 6:30 am ET, ES futures quote 4,512.75, up 12.75 points from the prior settlement. You’re long two ES contracts, so you see an unrealized gain of 12.75 × $50 × 2 = $1,275. The implied cash open is around 4,512.75, suggesting the S&P 500 will gap up roughly 12.75 points at 9:30 am ET. Pre-market volume is heavy, advance/decline is positive, and VIX futures are down a bit, all backing bullish sentiment. You decide to hold into the open, expecting follow-through once institutional flow shows up.
Bearish Overnight Move
Prior Nasdaq-100 cash close: 15,000.00. Overnight, disappointing earnings from a mega-cap tech stock send NQ futures to 14,970.00, down 30 points. You’re short one NQ contract, so you gain 30 × $20 = $600. The implied cash open is near 14,970, a 30-point gap lower. Pre-market volume is elevated and VIX futures are rising, backing the bearish read. You plan to cover the short near the open if selling picks up, or hold if the market stabilizes and shows mean-reversion signs.
Volatile Reversal Scenario
Prior Dow cash close: 34,000. At 3:00 am ET, geopolitical headlines push YM futures down 150 points to 33,850. You’re holding two long YM contracts, facing a paper loss of 150 × $5 × 2 = $1,500. By 7:00 am ET, calmer updates and a dovish central-bank comment flip the move; YM climbs back to 34,050, now up 50 points from the prior close. Your position swings from negative $1,500 to positive $500 (50 × $5 × 2). This volatility shows why you use limit orders, watch news flow constantly, and size positions conservatively overnight.
How you might read each scenario:
- Bullish continuation – if pre-market breadth and volume confirm the futures rally, you add to longs or hold through the open expecting gap-and-go.
- Bearish follow-through – rising VIX futures and negative advance/decline support holding shorts or starting new bearish positions before the open.
- Reversal into the open – sharp overnight swings that fade by 9:00 am ET often signal weak conviction; you wait for the first 30 minutes of cash trading to confirm direction before committing capital.
Final Words
In the action, we walked through how after-hours equities and near‑24/5 index futures differ, the key trading windows, and contract specs (ES, NQ, YM, micro).
We showed how overnight moves translate into implied opens, which indicators matter (VIX, pre-market volume, futures deltas), and where to find live quotes. We also covered order mechanics, thinner liquidity, and concrete risk controls to protect positions.
Use these signals to size positions, set limits, and plan entries. Keep watching after-hours stock market futures — they often give an early read on the next day’s bias when paired with smart risk rules.
FAQ
Q: Should a 70 year old get out of the stock market?
A: A 70-year-old should not automatically get out of the stock market. Decisions depend on retirement timeline, income needs, and risk tolerance; consider a mix of income assets and some equities for growth, and consult an advisor.
Q: Is the stock market up after hours?
A: The stock market after hours can be up or down depending on news and trades. Equity after-hours run about 4:00 pm–8:00 pm ET, while index futures trade nearly 24 hours and show early directional clues.
Q: What is the 7% loss rule?
A: The 7% loss rule is a stop-loss guideline to exit a position after it drops 7% from purchase to limit losses; use it carefully, adjusting for volatility, holding period, and tax or income needs.
Q: How do futures trade after hours?
A: Futures trade after hours on electronic platforms like CME Globex, running Sunday 6:00 pm–Friday 5:00 pm ET with a daily 5:00–6:00 pm ET maintenance break; they react to news and shape the implied open.