


Most investors treat earnings recaps like a scoreboard.
They miss the real story: whether the business is actually getting healthier or just masking problems.
This post gives a clear, five-step way to break down quarterly results fast: revenue, EPS, margins, guidance, and context.
You’ll see how surprises move stocks, what to trust in adjusted numbers, and which metrics expose real momentum.
Master these steps and you’ll make smarter, faster investment calls instead of guessing.
How to Read a Quarterly Earnings Report (Start Here)

Revenue, EPS, operating margins, and guidance are where you start. Always. They answer the questions that actually matter: is the company growing? Are they making more per share? Do they run a tight ship? And what’s coming next?
These four numbers tell you if the business model works, if profits are getting better or worse, and whether management thinks the momentum’s real. Read these first. Everything else can wait.
YoY and QoQ comparisons show you if things are getting better or falling apart. Year-over-year filters out the seasonal stuff (retail always crushes Q4, software firms close deals in the last week of every quarter). So when you compare Q1 2026 to Q1 2025, you’re seeing actual growth. Quarter-over-quarter shows you momentum shifts. Revenue up 8% YoY but down 3% QoQ? That’s deceleration, even if the annual number looks fine.
You need both. Raw numbers don’t mean much on their own.
And here’s the thing: actual results mean nothing without context. A company reports $1.20 billion in revenue. Sounds great, right? Not if analysts were expecting $1.30 billion. The market’s going to punish that. But $900 million might send the stock flying if consensus was only $850 million. Expectations set the baseline. Surprises move the price.
Five steps to read the headlines:
- Grab the reported revenue. Compare it to consensus and to the same quarter last year.
- Look at GAAP EPS and adjusted EPS. Calculate the surprise: (Actual − Consensus) / Consensus × 100.
- Check gross margin, operating margin, net margin. Compare each to last quarter and last year.
- Find the guidance ranges for revenue and EPS. Compare the midpoints to prior guidance and consensus.
- Calculate YoY growth: (This quarter − Same quarter last year) / Same quarter last year × 100.
You’ll know in under five minutes if the report’s clean or messy.
Breaking Down the Core Financial Metrics
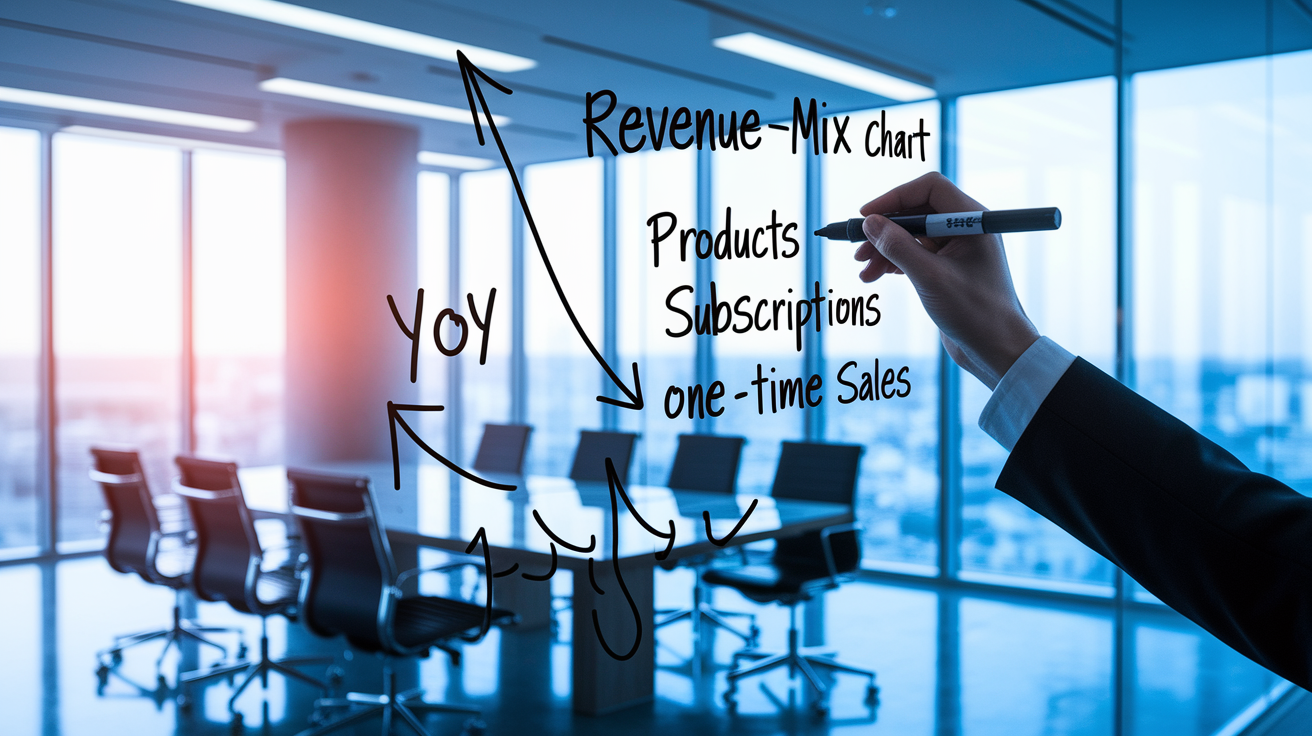
Revenue growth tells you if demand’s strong or weak. But you can’t stop at the top line. Break it down by segment, by region, by subscription versus one-time sales. A company reports 15% total growth. Looks healthy. Then you see 90% of that came from one new product and the legacy business shrank 5%. That’s a different story.
Calculate segment growth separately. YoY and QoQ. Revenue accelerating from 8% last quarter to 12% this quarter? Demand’s picking up or a product launch is working. Decelerating from 15% to 9%? You need to know why. Is competition heating up? Are customers holding back? Did they run into supply problems?
EPS is net income divided by shares outstanding. Changes can come from better operations, buybacks, or one-time adjustments. If net income rises 10% but EPS jumps 15%, they probably bought back shares. The math lifts EPS automatically. If net income climbs but EPS stays flat, dilution from stock comp or a secondary offering is eating the gains.
You’ve got to separate GAAP EPS from adjusted EPS. Adjusted numbers exclude stuff like restructuring charges, acquisition costs, asset write-downs. When adjusted EPS is $1.00 but GAAP is $0.70, that $0.30 gap is what they excluded. And if they’re taking “one-time” charges every single quarter for three quarters straight? That’s not one-time. That’s the real cost of doing business.
Margins reveal efficiency and pricing power. Gross margin (gross profit / revenue) shows what’s left after direct costs like materials, labor, shipping. Gross margin drops from 50% to 45%? Input costs are rising, pricing’s under pressure, or they’re shifting toward lower-margin products. Operating margin (operating income / revenue) captures efficiency after sales, marketing, R&D, admin expenses. Operating margin expanding from 18% to 21%? They’re scaling better or controlling costs. Net margin (net income / revenue) is the bottom line after interest, taxes, everything.
Track margins over at least four quarters. Temporary compression might be planned investment. Persistent contraction? That’s a structural problem. Eroding competitive position or unsustainable cost inflation.
Net income trends connect the quarter to the long game. Steady net income growth (10–15% annually over multiple years) supports premium valuations. It signals a durable business. Volatile net income (profit to loss or doubling then halving) raises questions about stability and earnings quality.
Compare net income to operating cash flow. If net income is $150 million but operating cash flow is only $80 million, something’s off. Accrual accounting or aggressive revenue recognition might be inflating earnings. Sustainable profitability requires cash generation to match or exceed net income over time.
| Metric | What It Indicates | Common Red Flags |
|---|---|---|
| Revenue Growth | Customer demand and market share trends; accelerating growth suggests strong positioning | Growth slowing for 2+ consecutive quarters; reliance on one segment masking declines elsewhere |
| Operating Margin | Efficiency at converting sales into operating profit after all operating expenses | Margin compression >200 bps YoY or QoQ without clear explanation; persistent margin below peers |
| EPS (Adjusted vs GAAP) | Per-share profitability; adjusted EPS shows recurring operational earnings | Large, recurring gap between adjusted and GAAP; frequent “one-time” charges every quarter |
Expectations vs. Actuals: Understanding Market Reaction

Analyst estimates are the baseline. Sell-side researchers model company financials based on guidance, industry data, historical trends. Then they publish forecasts that get compiled into consensus estimates. You can find these on Bloomberg, FactSet, Yahoo Finance, Seeking Alpha.
The consensus is what the market expects. Actual results get judged against this number, not just against prior quarters. When a company reports $1.20 billion versus consensus of $1.15 billion, that $50 million beat (4.3% surprise) matters more for the stock price than whether revenue grew 10% or 15% YoY.
Positive surprises (beating estimates by a significant margin) often trigger sharp rallies. Analysts revise models upward, institutional investors add to positions, algos buy on momentum. Negative surprises (missing estimates) cause steep sell-offs as investors re-price the stock for weaker fundamentals and lower forward estimates.
The size of the surprise matters. A 2% revenue beat might push the stock up 1–2%. A 10% EPS beat plus raised guidance can drive a 10–15% rally. A 5% revenue miss paired with lowered guidance can erase 15–20% of market cap in one session.
Stock reactions are asymmetric. Markets punish misses harder than they reward beats. Loss aversion and the risk of deteriorating trends.
Four reasons results beat or miss:
Demand surge or collapse. Unexpectedly strong orders or a sudden drop in sales (economic slowdown, competitor launch, supply disruption).
Cost overruns or efficiency gains. Input costs spiking beyond forecasts (raw materials, labor, logistics) or better margins from automation or pricing power.
Timing shifts. Revenue pulled forward from next quarter (early renewals, accelerated shipments) or delayed (customer budget freezes, contract negotiations).
One-time items and adjustments. Large gains or charges not included in guidance (asset sales, litigation settlements, restructuring) that distort GAAP results relative to adjusted estimates.
Evaluating Guidance and Management Commentary
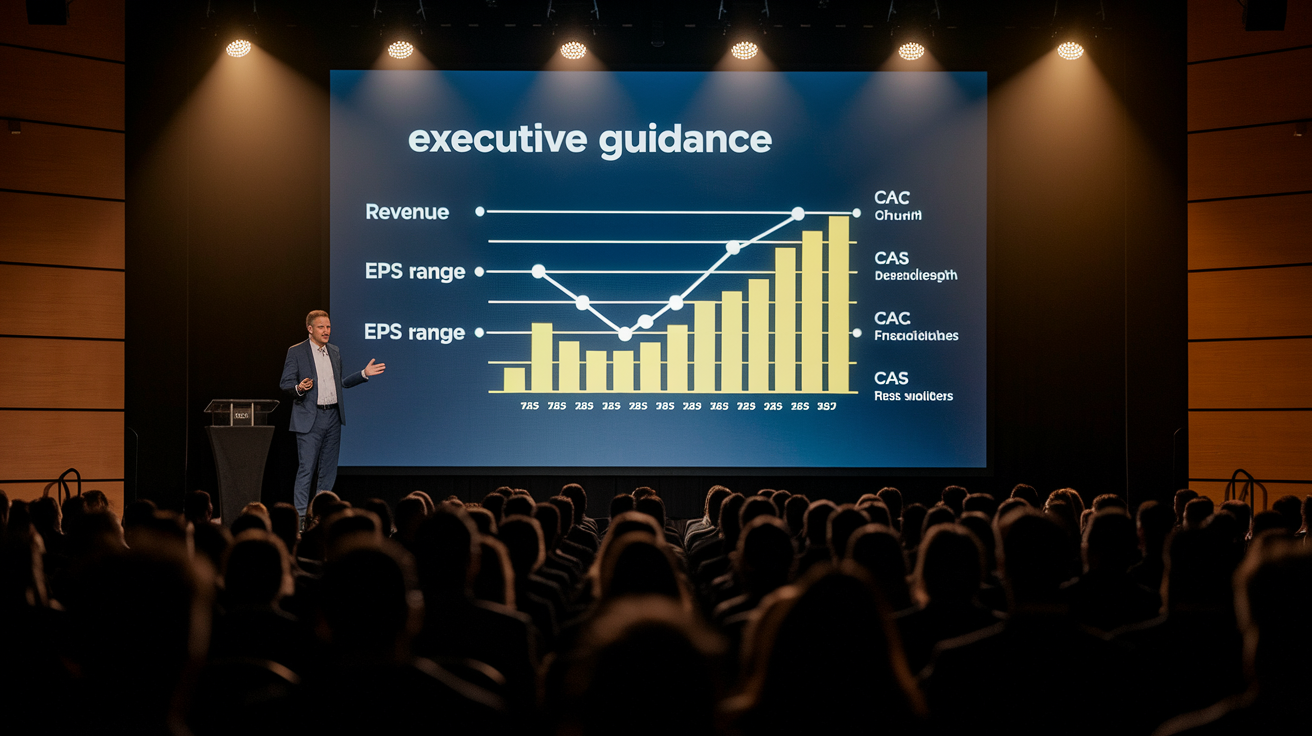
Forward guidance usually includes revenue ranges, EPS ranges, sometimes margin or capex projections for the next quarter and full fiscal year. Companies provide a range (Q2 revenue of $1.25 billion to $1.30 billion) and investors focus on the midpoint ($1.275 billion).
Compare the new midpoint to prior guidance and to consensus. If the prior midpoint was $1.20 billion, the company raised guidance by 6.25%. If consensus was $1.28 billion, the new midpoint is slightly below expectations.
Guidance revisions drive valuation adjustments. A 5% upward revision often leads to higher forward earnings estimates and multiple expansion. A 10% cut can compress the P/E multiple and trigger downgrades. Calculate the implied growth rate from guidance. If full-year midpoint is $5.00 billion on a base of $4.50 billion, that’s 11.1% growth.
Management commentary explains the business environment, strategic priorities, drivers behind the numbers. Strong commentary quantifies opportunities: “We added 1.2 million new subscribers this quarter, up 30% YoY, driven by our new pricing tier launched in March.” Weak commentary hedges or stays vague: “Market conditions remain challenging, and we’re monitoring the situation closely.”
Flag specific operational metrics. Customer acquisition costs, churn rates, pricing realization, pipeline conversion rates. Compare them to prior quarters. Churn rises from 2.0% to 2.8%? That’s a red flag even if revenue grew. Average revenue per user climbs from $45 to $52? That’s pricing power or successful upselling.
Tone, strategic positioning, capital allocation plans reveal confidence and priorities. A confident team raises guidance, expands investments in growth, offers specific targets: “We’re increasing R&D spend by $50 million next quarter to accelerate our AI roadmap.” A cautious team lowers guidance, cuts costs, speaks in generalities: “We’re taking a prudent approach given macro uncertainty.”
Long-term strategic commentary shapes multi-year investment theses. New product launches, market expansions, M&A, capital returns (buybacks, dividends) affect how you model future cash flows. If management announces a $500 million buyback authorization while free cash flow is only $300 million annually, that signals either strong confidence in future cash generation or potential over-leverage.
Identifying Red Flags in Quarterly Results

Declining margins despite rising revenue? The company’s sacrificing profitability for growth. That works temporarily, but it’s not sustainable if margins keep compressing. Revenue grows 15% YoY but gross margin falls from 48% to 42% (down 600 bps)? Rising input costs, pricing pressure from competitors, or a product mix shift toward lower-margin items is eroding profitability faster than volume gains can offset.
Operating margin declines are worse. Operating margin drops from 20% to 15% while revenue climbs? Operating expenses (sales, marketing, G&A, R&D) are growing faster than revenue. Poor cost control or unsustainable spending to chase growth.
Frequent “one-time” charges that recur every quarter or year aren’t one-time. They’re recurring operating costs disguised to inflate adjusted EPS. A company reports restructuring charges for six consecutive quarters totaling $200 million? Restructuring is effectively normal operations, not an exceptional event.
Acquisition-related amortization or stock-based comp labeled as adjustments can hide real economic costs. Track the cumulative dollar amount of adjustments over four to eight quarters. If adjustments exceed 10–15% of reported revenue, the adjusted numbers likely overstate sustainable profitability.
Cash flow divergence from net income signals earnings quality issues. Net income is accrual-based accounting. It can be influenced by revenue recognition timing, depreciation schedules, non-cash charges. Operating cash flow measures actual cash generated from operations.
When net income is $180 million but operating cash flow is only $90 million, that $90 million gap suggests aggressive revenue recognition (booking sales before cash is collected), rising working capital needs (inventory build-up or extended payment terms), or non-cash gains inflating earnings.
Free cash flow (operating cash flow minus capex) provides the clearest picture of cash available for debt repayment, dividends, buybacks. Negative free cash flow for multiple quarters, especially when paired with rising net income, is a major red flag.
Inventory spikes or accounts receivable build-ups often come before revenue slowdowns. Inventory grows 40% YoY while revenue grows only 15%? The company’s stockpiling unsold goods. Either anticipating future demand that may not show up or struggling to sell current production. Rising inventory days (Inventory / Cost of Goods Sold × 365) indicates slower turnover.
If accounts receivable grows faster than revenue (receivables up 25% while revenue is up 10%), customers are taking longer to pay or the company’s extending more generous payment terms to close sales. Both signs of weakening demand. Days sales outstanding (DSO), (Accounts Receivable / Revenue × 365) rising by 20+ days YoY is a warning that revenue quality is deteriorating.
Using Earnings Reports to Make Investment Decisions

You need context. Place quarterly results against at least eight to twelve quarters to distinguish cyclical noise from structural shifts. One strong quarter after three weak ones might reflect a seasonal bounce or one-time contract win, not a turnaround. One weak quarter after twelve consecutive beats might be temporary, not the start of a decline.
Plot rolling four-quarter averages for revenue growth, margin trends, free cash flow. Smooth out the volatility and identify direction. Rolling four-quarter average revenue growth has decelerated from 18% to 10% over the past year? That trend matters more than whether the latest quarter grew 12% or 14%.
Consistency in earnings quality (steady free cash flow conversion, stable margins, predictable revenue growth) supports higher valuation multiples. Investors can model future performance with greater confidence.
Valuations shift immediately after earnings as analysts update forward estimates and investors re-price stocks. A strong quarter with raised guidance typically leads to upward revisions in fiscal-year EPS estimates, which compresses the forward P/E ratio (current price / updated forward EPS).
Stock trades at $60 with forward EPS of $4.00 (P/E of 15x). Guidance raises EPS expectations to $4.50. The P/E drops to 13.3x, making the stock appear cheaper unless the price rises. Markets often re-rate the stock by expanding the multiple. Investors might bid the stock to $67.50 to restore a 15x P/E, producing a 12.5% gain.
Conversely, a guidance cut from $4.00 to $3.50 pushes the P/E to 17.1x. If investors demand a 15x multiple, the stock falls to $52.50. A 12.5% decline. Valuation multiples (P/E, EV/EBITDA, price-to-sales) expand for companies demonstrating accelerating growth and improving margins, and compress for those with decelerating growth or margin pressure.
Industry conditions frame whether results are strong or weak relative to peers and broader sector trends. A retailer growing same-store sales 3.5% looks solid in isolation, but weak if the retail sector average is 6%. A semiconductor company guiding for flat revenue next quarter is weak if the semiconductor cycle is in an upcycle with peers guiding for 10–15% growth.
Compare company-specific metrics (revenue growth, margins, free cash flow) against sector medians and top-quartile performers to assess relative positioning. Macro conditions (interest rates, commodity prices, currency fluctuations, GDP growth) shape earnings interpretation. Software companies with subscription models are more resilient in downturns than cyclical industrials. So a 5% revenue miss for a software firm may be more concerning than a 10% miss for an industrial distributor during a recession.
Three ways to integrate earnings data into broader strategy:
Update financial models and price targets. Recalculate forward P/E, PEG ratio (P/E / growth rate), and DCF valuations using new revenue, margin, and free cash flow assumptions. Adjust position sizing if valuation becomes stretched or attractive.
Compare results across portfolio holdings. Rank stocks by earnings quality (free cash flow / net income), growth acceleration (QoQ and YoY revenue trend), and guidance revisions. Rotate capital toward names with improving fundamentals and away from deteriorating ones.
Identify sector rotation signals. Aggregate quarterly results across sectors to spot emerging trends. If technology companies are broadly beating and raising while consumer discretionary names are missing and cutting, reallocate toward technology and reduce consumer discretionary exposure.
Final Words
You learned a fast framework: scan headline revenue, EPS, margins, guidance and YoY trends first, then dig into quality flags and management tone.
Keep this earnings recap how to analyze quarterly results checklist handy when earnings season arrives — it turns noisy filings into clear signals you can act on.
Stick to the core steps and watch expectations vs actuals. Each report is a chance to sharpen your calls and build confidence.
FAQ
Q: How to read a quarterly earnings report? / How to analyse quarterly results?
A: Reading and analysing a quarterly earnings report means focusing on headline revenue, EPS, margins, and guidance, comparing year-over-year and sequential changes, and checking one-time items and cash flow to assess quality.
Q: Is it better to have high or low EPS?
A: Whether a high or low EPS is better depends: higher EPS typically means more profit per share, but check for one-time items, share-count changes, and sustainability to judge true quality.
Q: What are the metrics of earnings report?
A: The key metrics in an earnings report are revenue, net income, EPS (basic and diluted), operating margins, cash flow, and forward guidance; investors also watch YoY and QoQ growth and one-time adjustments.