

Is the Fed really finished with rate moves?
Right now the federal funds target range is 3.50% to 3.75%.
The FOMC paused on April 29, 2026, so the effective rate usually sits near the midpoint.
That pause matters: it helps set loan and mortgage costs, shapes yields across markets, and tells investors how hawkish (more likely to raise) or dovish (more likely to cut) the Fed might be.
This post explains what that band means for borrowers, savers, and markets – and what to watch before the June 17 decision.
Latest Federal Funds Rate Overview
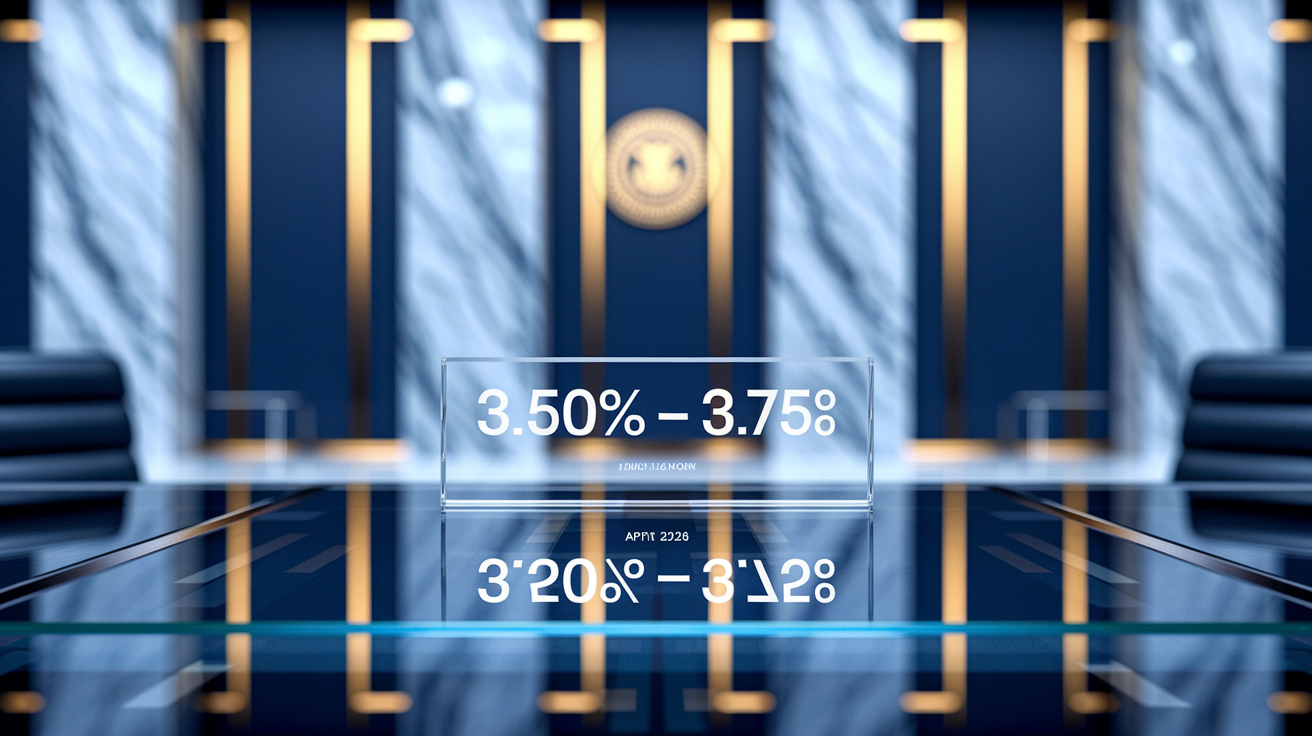
The current federal funds target range sits at 3.50% to 3.75%. The Federal Open Market Committee set that band on April 29, 2026. This target represents the interest rate range the Fed wants when depository institutions lend reserve balances to each other overnight. The effective federal funds rate (the actual weighted average of transactions) usually lands somewhere inside that corridor.
At the April 2026 meeting, the FOMC voted to keep the target range where it was. That’s a pause. The next scheduled policy decision comes on June 17, 2026, when the committee will look at fresh economic data and decide whether to hold, hike, or cut.
Quick snapshot:
- Current Target Range: 3.50% to 3.75% (effective December 11, 2025)
- Effective Federal Funds Rate: Updates every day and tends to track near the midpoint of the target range (around 3.625%)
- Last FOMC Action: April 29, 2026, target range held at 3.50% to 3.75%
Understanding the Federal Funds Rate
The federal funds rate is what depository institutions (banks and credit unions) charge each other to lend reserve balances overnight on an unsecured basis. The Federal Reserve sets a target range for this rate, which works as the main tool for implementing monetary policy. When the Fed wants to tighten financial conditions and cool inflation, it raises the target. When it wants to stimulate growth, it lowers it.
The “target” is the Fed’s policy goal. The “effective” rate is the actual volume-weighted median of overnight transactions. Market forces plus the Fed’s operational tools (interest paid on reserve balances and the overnight reverse repurchase facility) keep the effective rate inside or very close to the target range.
Core functions:
- Anchors short-term interest rates: Influences yields on Treasury bills, commercial paper, money-market funds
- Signals monetary policy stance: Rising target means tightening. Falling target means easing
- Transmits to consumer and business borrowing costs: Affects the prime rate, adjustable-rate mortgages, credit cards, auto loans, business credit lines
- Supports the Fed’s dual mandate: Helps manage maximum employment and stable prices by controlling the cost of overnight money
Recent Rate Change History

The Federal Reserve ran through a series of rate adjustments over the past 18 months to balance inflation risks against growth and employment conditions. The tightening cycle that started in 2022 eventually shifted to a more neutral stance as inflation cooled and labor market pressures eased.
Here’s the chronological sequence of FOMC rate decisions since late 2024:
- December 11, 2025 — Cut by 25 basis points to 3.50% to 3.75%
- October 30, 2025 — Cut by 25 basis points to 3.75% to 4.00%
- September 18, 2025 — Cut by 50 basis points to 4.00% to 4.25%
- July 31, 2025 — Held at 4.50% to 4.75%
- June 12, 2025 — Held at 4.50% to 4.75%
- April 30, 2025 — Held at 4.50% to 4.75%
- March 19, 2025 — Cut by 25 basis points to 4.50% to 4.75%
Each decision reflected incoming data on inflation, the labor market, and financial conditions. The committee cited progress on price stability and resilient employment as key reasons for the easing decisions during the second half of 2025.
Upcoming FOMC Meeting Dates

The Federal Open Market Committee holds eight regularly scheduled meetings each year to review economic conditions and set the federal funds target range. Policy statements typically drop at 2:00 PM Eastern on the final day of each meeting, followed by a press conference when the Chair adds more context.
Scheduled FOMC meetings for 2026:
- June 16 to 17, 2026 — Next policy decision expected June 17
- July 28 to 29, 2026 — Mid-summer assessment
- September 15 to 16, 2026 — Pre-autumn policy review
- October 27 to 28, 2026 — Final pre-election meeting
Between these meetings, Fed officials monitor real-time data and deliver public remarks that can offer forward guidance. Markets watch the statement language closely. The Summary of Economic Projections (released quarterly) and the “dot plot” of individual rate forecasts help gauge the likely path of policy.
Factors Influencing Rate Decisions
The FOMC looks at a broad array of economic indicators to decide whether the current target range supports the Fed’s dual mandate of maximum employment and stable prices. Data releases in the weeks before each meeting shape the committee’s view on inflationary pressures, labor market tightness, and growth momentum.
Incoming reports on inflation remain the primary driver. The committee tracks both the Consumer Price Index (headline and core excluding food and energy) and the Personal Consumption Expenditures price index, which is the Fed’s preferred gauge. A sustained move above the 2 percent target usually prompts discussion of tightening. Consistent readings at or below target support holding or easing.
Key indicators monitored by the FOMC:
- Core PCE inflation (year over year): The Fed’s benchmark measure. Readings above 2% sustained over several months signal upside risk
- CPI (headline and core): Broader consumer price basket. Divergence from PCE can highlight shifts in energy or shelter costs
- Unemployment rate and payroll growth: Tight labor markets (low unemployment, strong job gains) can fuel wage pressure and demand driven inflation
- Average hourly earnings: Wage growth above 3 to 4% annualized may point to sticky inflation
- Real GDP growth: Persistent above trend growth can overheat the economy. Sustained below trend growth raises recession risk
- Financial conditions and credit spreads: Tightening in corporate bond spreads, equity volatility, or bank lending standards can transmit monetary policy faster than the target rate alone
The committee also weighs global developments. Foreign central bank moves, commodity prices, and geopolitical risks can affect U.S. inflation and growth through trade and financial linkages.
Historical Trend Overview

Over the past three decades, the federal funds rate has moved through pronounced cycles driven by inflation shocks, financial crises, and shifts in the economic outlook. In the early 2000s, the target rate peaked near 6.5 percent before the dot-com recession prompted aggressive easing. The global financial crisis in 2008 to 2009 pushed the Fed to drop the target to a range of 0.00% to 0.25%, where it stayed for seven years to support recovery and lift inflation back toward target.
The normalization that began in late 2015 raised the target gradually to a range of 2.25% to 2.50% by late 2018, but trade tensions and slowing global growth led to three precautionary cuts in 2019. The COVID-19 pandemic triggered an emergency return to near zero in March 2020, with the target held at 0.00% to 0.25% through early 2022. The subsequent tightening cycle (launched to combat post-pandemic inflation) lifted the target range above 5.00% by mid-2023, marking the most aggressive sequence of hikes since the early 1980s. The chart below traces the effective federal funds rate from 2000 through April 2026, highlighting these major turning points.
| Period | Peak/Trough Rate | Driver |
|---|---|---|
| 2000 to 2001 | ~6.5% to 1.75% | Dot-com bust, recession easing |
| 2008 to 2009 | 5.25% to 0.00% to 0.25% | Global financial crisis |
| 2015 to 2018 | 0.00% to 0.25% to 2.25% to 2.50% | Post-crisis normalization |
| 2020 | 1.50% to 1.75% to 0.00% to 0.25% | COVID-19 pandemic emergency |
| 2022 to 2023 | 0.00% to 0.25% to 5.25% to 5.50% | Post-pandemic inflation surge |
| 2025 to 2026 | 5.25% to 5.50% to 3.50% to 3.75% | Inflation moderation, easing cycle |
This long run perspective shows that the current 3.50% to 3.75% target range sits well above the emergency era lows but remains below the pre-financial crisis norm. That reflects a monetary policy that’s shifted from aggressive tightening to a more neutral or slightly restrictive stance as inflation pressures ease.
Final Words
We put the latest federal funds target range front and center and showed what it means for markets and borrowers.
You got the exact target range and effective rate, the date of the last FOMC decision, recent moves, upcoming meetings, the data that drives policy, and the long-term trend snapshot.
Keep watching the current fed funds rate and the calendar — they’ll guide rates, yields, and market tone. With this checklist, you’re better positioned to stay informed and act with confidence.
FAQ
Q: What is the Fed’s new interest rate?
A: The Fed’s new interest rate is the federal funds target range set by the FOMC; check the Federal Reserve’s latest FOMC statement or its website for the exact target range and decision date.
Q: What is the Fed prime rate today?
A: The Fed prime rate today is the prime rate banks use as a benchmark; it’s set by banks, not the Fed—check the Wall Street Journal’s published prime or your lender for today’s figure.
Q: Which bank in the USA is government owned?
A: No commercial bank in the USA is fully government-owned; the Federal Reserve is the U.S. central bank, while GSEs like Fannie Mae and Freddie Mac have government ties but aren’t retail banks.
Q: What is the prime rate vs. fed funds rate?
A: The prime rate versus the fed funds rate is: the prime is banks’ lending benchmark to top customers; the fed funds rate is the overnight interbank rate the Fed targets to guide monetary policy.