

Think the Fed will start cutting rates this year? The market mostly disagrees.
The next big date is the June 16–17, 2026 FOMC meeting, when officials set policy and publish a fresh dot plot (the Fed’s own rate forecasts).
Futures and the CME FedWatch Tool now point to a pause, with low odds of a hike and only modest chances of cuts later in 2026.
This post explains why, covering CPI, PCE (the Fed’s preferred inflation gauge), jobs and GDP, how tools turn prices into probabilities, and what data could flip the odds.
Current Outlook for Fed Meeting Predictions and Market-Implied Rate Paths
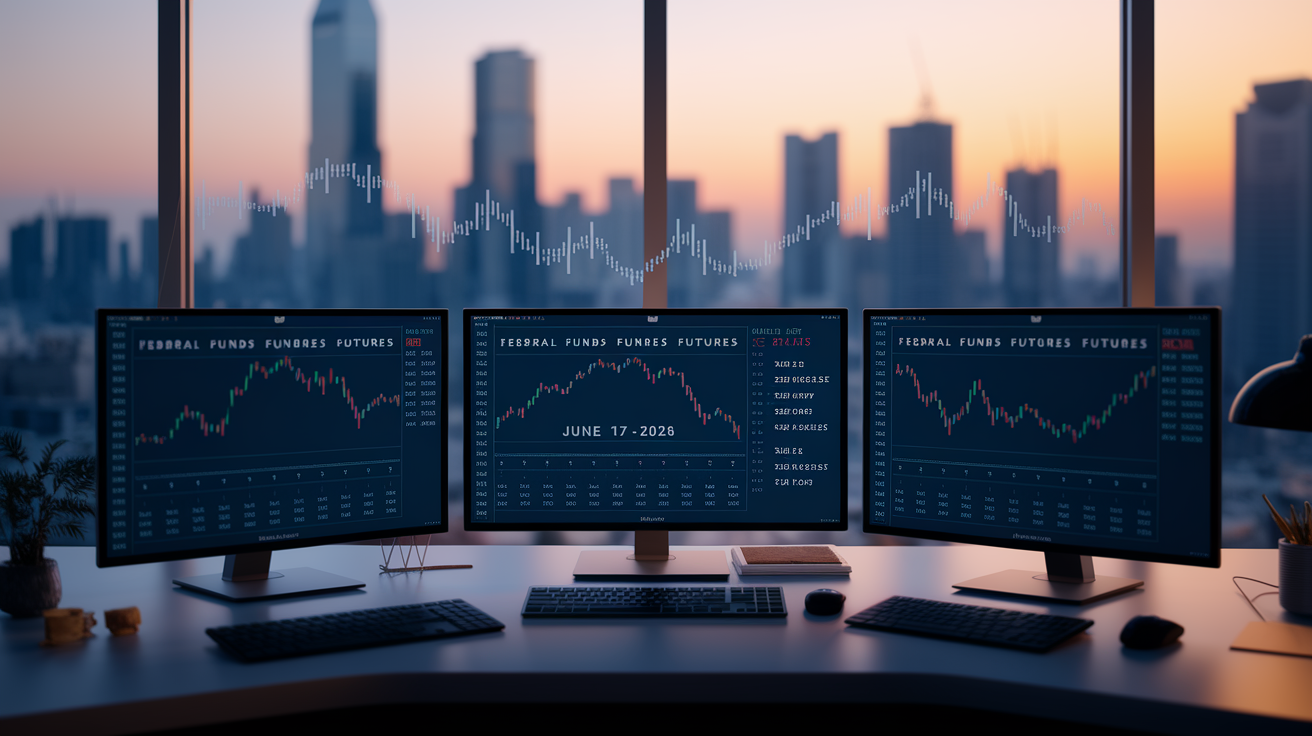
The federal funds rate sits between 3.50 and 3.75 percent right now. Next big date on the calendar: June 16–17, 2026, when the FOMC meets and drops a fresh Summary of Economic Projections. That means traders get two pieces of intel at once—the actual policy call and an updated dot plot showing where officials think rates are headed.
Futures markets are already baking in expectations for June and beyond. The consensus? A pause is overwhelmingly likely.
Market-implied probabilities come straight from 30-day Federal Funds futures (the /ZQ contract family). For the December 2026 meeting, futures currently put a 78.2 percent chance on rates staying put through year-end. There’s a 15.4 percent shot at a single 25 basis-point cut by then, and only 5.4 percent odds of a hike. That spread tells you the market thinks the Fed’s close to neutral and doesn’t see much reason to tighten anytime soon, even with inflation still bouncing around.
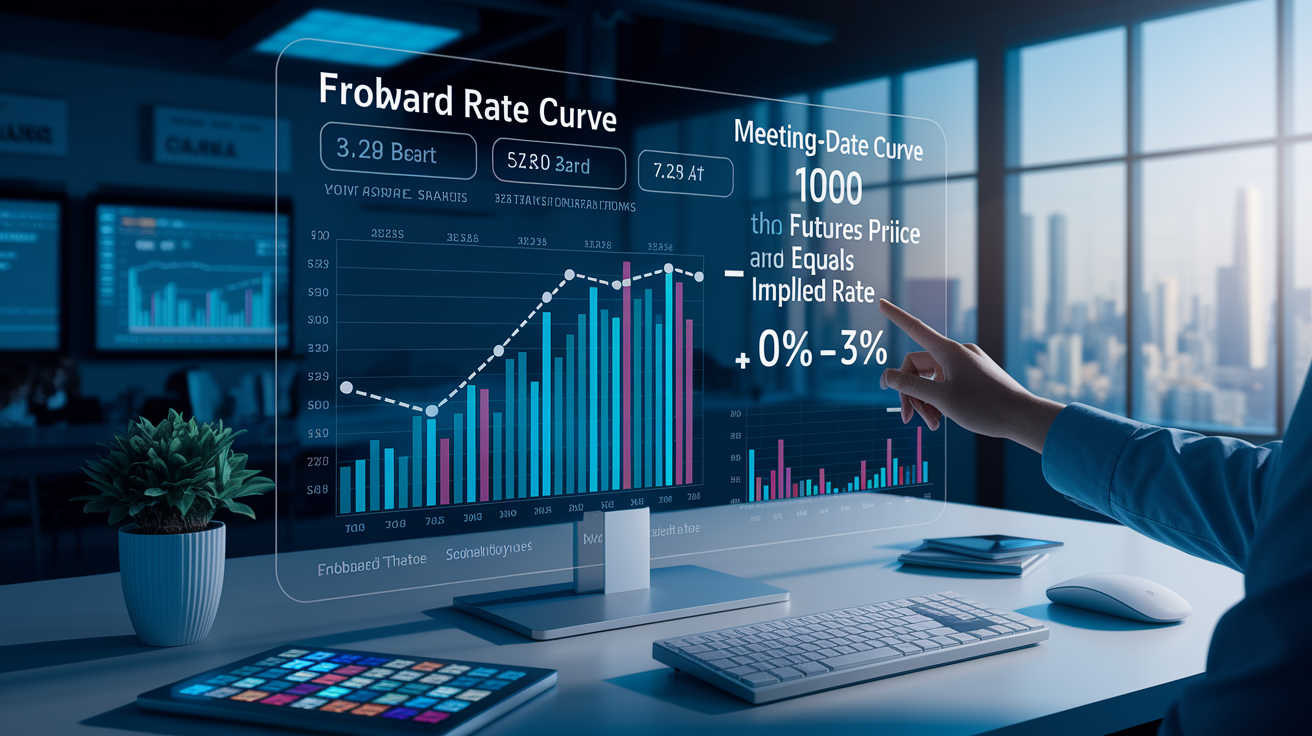
The CME FedWatch Tool is the go-to for reading these odds. It updates live, pulls from actual trades, and the math is transparent. Simple formula: take the daily settlement price of a monthly /ZQ contract, subtract it from 100, and you’ve got the implied fed funds rate. The April 2026 contract (/ZQJ26) recently settled at 96.36, so 100 minus 96.36 gives you roughly 3.64 percent. That lands smack in the middle of the current 3.50 to 3.75 percent range, signaling zero expected change by April.
Here’s what the current market snapshot looks like for upcoming meetings:
June 2026 (next meeting): Futures pricing points to no change. The implied rate tracks dead center in the current band.
September 2026: Cut probabilities tick up a bit, but the curve still anchors near today’s policy.
December 2026: Market assigns 78.2 percent to unchanged, a tiny 5.4 percent tail risk of a hike, and 15.4 percent easing odds.
2027 pathway: The futures curve slopes gently lower, implying gradual cuts spread over quarters instead of aggressive front-loaded easing.
Dot plot versus futures: The March 2026 SEP showed the median official view drifting toward a 3.25 to 3.75 percent range over time. Slightly more dovish than what futures were pricing, but that gap has narrowed as officials dialed back the easing talk.
Analyst consensus has landed in wait-and-see territory for June. One major wealth manager’s base case calls for maybe one or two cuts in 2026 if the economy cooperates and inflation keeps moderating. But a minority of strategists still see real odds of a hike later this year if energy prices stay high or geopolitical chaos reignites inflation pressure. The FedWatch probabilities capture that tension perfectly. Stability for now, but a hot CPI print or one hawkish Fed speaker can shift the odds by double digits in days.
Fed Meeting Predictions Based on Economic Indicators Driving the Outlook
Consumer Price Index data have been the main catalyst behind recent probability swings. In March 2026, headline CPI jumped from 2.4 percent in February all the way to 3.3 percent. Gasoline accounted for about 75 percent of that monthly spike. That one-month acceleration immediately cooled rate-cut talk and made some analysts dust off the possibility of a hike if energy stays elevated. Personal Consumption Expenditures inflation (the Fed’s preferred gauge) also sits above target. The March 2026 SEP projects headline PCE at 2.7 percent for the full year 2026, dropping to 2.2 percent in 2027, and finally hitting the 2.0 percent target by 2028. Core PCE follows the same 2.7 → 2.2 → 2.0 percent path.
Labor-market signals add more complexity. The March SEP forecasts unemployment at 4.4 percent in 2026, edging down to 4.3 percent in 2027, then stabilizing at 4.2 percent in 2028 and the longer run. Back in late November 2025, New York Fed President John Williams publicly emphasized weaker labor conditions. That single comment swung the December 2025 cut probability from roughly 30 percent to about 90 percent in two weeks. Similar remarks ahead of June 2026 could move the futures curve again, especially if monthly jobs reports show further softening or wage growth slows faster than expected.
GDP growth projections feed into the policy calculus too. The SEP pegs real GDP at 2.4 percent for 2026, tapering to 2.3 percent in 2027, 2.1 percent in 2028, and a 2.0 percent longer-run trend. Healthy enough to avoid recession pricing, but not strong enough to force the Fed into tightening mode unless inflation overshoots. You’ve got moderate growth, sticky core inflation, and a labor market that’s cooling but not collapsing. That combo leaves the committee in wait-and-see mode.
The table below breaks down the four main indicators driving market-implied Fed meeting predictions, with their latest readings and what they signal for policy:
| Indicator | Latest Reading / Projection | Signal for Policy |
|---|---|---|
| CPI (headline) | 3.3% (March 2026), 75% from gasoline | Hawkish. Reduces cut odds if sustained |
| PCE / Core PCE | 2.7% (2026 SEP), declining to 2.0% by 2028 | Neutral to slightly dovish. Inflation path moderating but slow |
| Unemployment Rate | 4.4% (2026 SEP), trending to 4.2% longer run | Neutral. Labor market stable, not tight enough to force hikes |
| GDP Growth | 2.4% (2026), declining to 2.0% longer run | Neutral. Growth supports no change, but doesn’t demand cuts |
How Fed Forecasting Tools Shape Fed Meeting Predictions
Forecasting tools turn raw futures prices into probabilities investors can actually use. The CME FedWatch Tool is the most widely tracked because it updates continuously, doesn’t require a subscription, and offers a simple three-tab interface: Current, Compare, and Chart. Each tab pulls from the same source (30-day Federal Funds futures) but presents it in ways that answer different questions. Current shows today’s odds for each target-range outcome at a selected FOMC meeting. Compare reveals how those odds shifted over one day, one week, or one month. Chart overlays multiple meeting dates so you can see the entire implied policy path at a glance.
The math is straightforward. Each /ZQ futures contract settles at a price reflecting the market’s expectation for the average effective fed funds rate during that contract month. Implied rate equals 100 minus the futures settlement price. For instance, the April 2026 contract (/ZQJ26) settled at 96.36, so the implied rate is 100 minus 96.36, which gives you 3.64 percent. Since the current target range is 3.50 to 3.75 percent, an implied rate of 3.64 percent sits comfortably in the middle. That signals no expected change by April. The tool then compares implied rates across successive contract months, attributes any step changes to specific FOMC meetings, and calculates the probability of each 25 basis-point move.
FedWatch Mechanics
To use the FedWatch Tool for a specific meeting, start by selecting the meeting date from the calendar at the top of the page. For the June 16–17, 2026 meeting, click that date and the interface loads the Target Range tab. Under Current, you’ll see a probability bar chart showing the odds for unchanged policy, a 25 basis-point cut, or a 25 basis-point hike. Under Compare, toggle between one-day, one-week, and one-month lookback windows to see how those probabilities shifted. A big one-month swing usually signals new data releases, Fed speaker comments, or geopolitical developments that changed the market’s view. Under Chart, you can stack multiple FOMC meetings side by side and watch how the entire forward curve evolves.
Dot Plot Interpretation
The dot plot is the Fed’s own forecast, published in the SEP four times a year. It shows where each of the 19 FOMC participants expects the federal funds rate to be at year-end for the current year, the next two calendar years, and the longer run. The FedWatch Tool includes a Dot Plot tab that overlays the latest SEP median projections onto the futures-implied path. The March 2026 SEP shifted the median dot downward from a prior 3.5 percent center toward an implied range of 3.25 to 3.75 percent, signaling that officials collectively expect gradual easing. When futures pricing diverges meaningfully from the dot plot, it often means the market sees risks (higher inflation, geopolitical shocks, election-related policy shifts) that the Fed hasn’t fully acknowledged yet.
Here’s how investors commonly use probability shifts ahead of meetings:
Compare one-month changes to spot when consensus flipped from cut to pause (or vice versa), then trace the shift back to a specific data release or Fed speech.
Watch for 50/50 splits in probabilities. Maximum uncertainty often precedes elevated volatility on meeting day.
Monitor the first meeting with non-zero hike odds as an early warning that markets are pricing tightening risk back into the curve.
Check implied rates for the nearest three contracts (/ZQ front month, month two, month three) to see if the curve is flat, inverted, or steepening. Each shape tells a different policy story.
Overlay dot plot medians with futures to gauge whether the Fed is ahead of or behind the market, then adjust duration and sector exposure accordingly.
Track probability changes on major data days (CPI, PCE, employment) to measure how sensitive the curve is to incoming prints and calibrate position sizing for the next release.
Why Fed Forecasting Tools Are Worth Watching explains how the FedWatch Tool converts daily futures settlement prices into meeting-specific probabilities using a weighted average of contracts that span each FOMC decision date. The tool assumes the effective fed funds rate will remain constant between meetings, attributes any rate change to the meeting itself, and solves for the probability distribution that best fits observed futures prices. That methodology is transparent and replicable, which is why traders, economists, and financial media all cite FedWatch as the benchmark for market-implied odds.
Fed Meeting Predictions in Historical Context
The current fed funds target range of 3.50 to 3.75 percent sits roughly 1.75 percentage points below the cycle peak of 5.25 to 5.50 percent that lasted through fall 2024. That peak was the Fed’s response to the highest inflation readings in roughly forty years. The committee held rates at that level for more than a year to make sure inflation was truly moderating. The first cut came in late 2024, followed by two more in quick succession, bringing policy to the current range by early 2025. The pace of easing has slowed since then. The market now expects a long pause.
Historical cycles show that once the Fed pivots from tightening to easing, the initial cuts tend to cluster, followed by a slower phase where the committee moves only when data confirm the next step. The 1995 “mid-cycle adjustment” and the 2019 “insurance cuts” are both examples of shallow easing cycles that ended without a recession. In both cases, the Fed cut rates by 75 basis points or less, paused, and eventually resumed tightening or held steady. Current predictions echo that pattern. Futures assign high odds to stability through late 2026, with only gradual cuts thereafter if inflation cooperates.
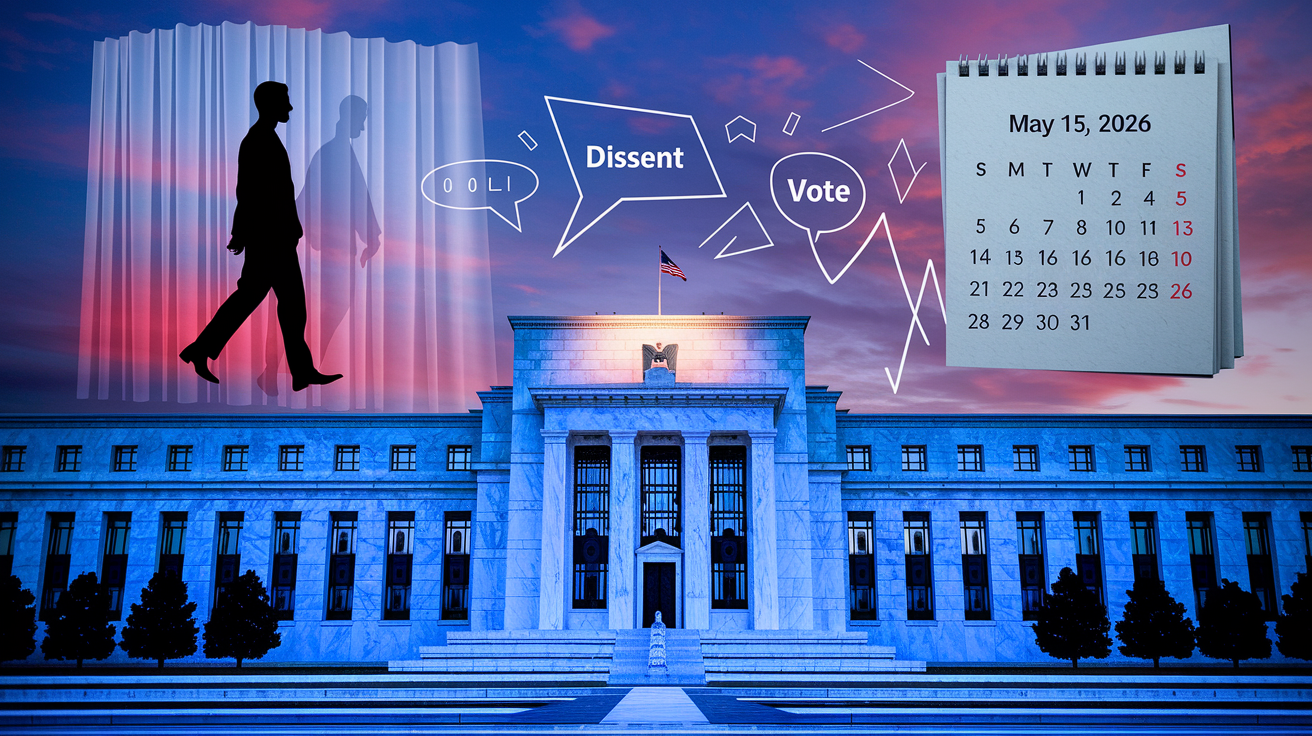
One notable feature of the current cycle is the persistence of dissents. Four consecutive FOMC meetings leading up to December 2025 included at least one dissenting vote. That signals internal debate over the appropriate pace of easing. Historically, sustained dissent clusters often appear near inflection points, either just before the Fed pivots policy direction or when the committee is evenly split on the risk balance. The December 2025 meeting saw Kansas City Fed President Jeffrey Schmid dissent against the cut. He’s expected to dissent again if the June 2026 meeting delivers another reduction. That pattern suggests the hawkish wing of the committee remains concerned about inflation risks, even as the majority favors cautious easing.
Key historical inflection points that inform current predictions:
November 21, 2025: New York Fed President John Williams publicly emphasized weaker labor-market conditions, triggering a sharp two-week swing in December cut odds from 30 percent to 90 percent. One of the fastest probability reversals on record.
March 2026 SEP release: The updated dot plot shifted the median year-end 2026 projection lower, signaling that officials collectively expect a slower pace of cuts than the market had priced in earlier winter.
CPI spike in March 2026: Headline inflation jumped from 2.4 percent to 3.3 percent in a single month, with 75 percent of the increase coming from gasoline. A reminder that energy shocks can quickly derail easing expectations.
Powell’s term expiration (May 15, 2026): The approaching end of the chair’s term introduces political and leadership uncertainty. That historically dampens the Fed’s willingness to make bold policy moves in the final months of a tenure.
Market Impact Scenarios Linked to Fed Meeting Predictions

Every shift in Fed meeting predictions ripples through fixed income, equities, currencies, and commodities. When futures probabilities tilt toward a cut, short-term Treasury yields typically fall as bond prices rise, mortgage rates edge lower, and equity valuations get a modest tailwind from the lower discount rate on future earnings. Flip it around: when the market reprices toward a pause or a hike, yields climb, existing bond prices drop, and rate-sensitive sectors (utilities, REITs, leveraged growth companies) often underperform.
Corporate earnings get hit directly by borrowing costs. A 25 basis-point move in the fed funds rate flows through to the prime rate, which adjusts the cost of corporate credit lines, commercial paper, and floating-rate debt. For companies with significant leverage, even a single quarter-point hike can compress margins if they can’t pass costs through to customers. On the consumer side, credit card APRs, auto loans, and adjustable-rate mortgages all move in tandem with the fed funds rate. Predictions of a pause or hike have immediate household budget implications.
Equity sector performance diverges sharply depending on the predicted path. In a rising-rate or pause scenario where inflation stays sticky, defensive sectors like consumer staples and utilities tend to hold up better. Their earnings are less cyclical and their dividend yields look more attractive relative to bonds. Discretionary sectors (autos, apparel, durable goods) face headwinds as higher borrowing costs dampen big-ticket purchases. In a rate-cut scenario, the opposite rotation often occurs. Growth and cyclical stocks rally, financials benefit from a steeper yield curve (if long rates stay higher), and REITs get relief from lower financing costs.
The table below compares expected reactions across major asset classes when Fed meeting predictions shift toward a cut, a pause, or a hike:
| Asset Class | Expected Reaction to Cut | Expected Reaction to Pause | Expected Reaction to Hike |
|---|---|---|---|
| Short-Term Treasuries (2Y, 5Y) | Yields fall; prices rise | Yields stable; limited movement | Yields rise; prices fall |
| Equities (broad market) | Modest rally; lower discount rate | Range-bound; focus shifts to earnings | Sell-off; higher discount rate pressures valuations |
| REITs | Rally; lower financing costs boost FFO | Consolidation; yield spread stable | Decline; higher debt service squeezes cash flow |
| Consumer Discretionary | Outperform; lower rates support spending | In-line; consumer health matters more | Underperform; higher loan costs delay purchases |
| Utilities & Staples | Underperform; investors rotate to growth | In-line; yield stability attracts income buyers | Outperform; defensive qualities valued |
| Gold | Rally; lower real yields reduce opportunity cost | Stable; driven more by dollar and geopolitics | Decline; higher real yields increase opportunity cost |
Near-term positioning themes heading into the June 16–17 meeting center on managing duration risk in fixed income and sector rotation in equities. If incoming CPI and PCE prints come in hotter than expected, traders will likely shorten duration and add exposure to inflation-protected securities or commodities. If data cool and the market reprices toward cuts later in 2026, extending duration and rotating into cyclicals and small caps becomes the higher-probability play. The key is staying flexible and using the FedWatch probabilities as a real-time signal for adjusting portfolio tilts, rather than locking into a single scenario months in advance.
Analyst and Economist Commentary Behind Current Fed Meeting Predictions

Sell-side strategists and independent economists split into three main camps. The base case from one major wealth manager calls for one to two rate cuts in 2026, conditional on inflation moderating and the labor market staying stable. That view aligns closely with the March 2026 SEP median, which projects gradual easing over the next two years. Proponents of this scenario point to the steady decline in core PCE projections (from 2.7 percent in 2026 to 2.0 percent by 2028) and argue the Fed can afford patience as long as unemployment stays near 4.4 percent and GDP growth hovers around 2.4 percent.
A smaller but vocal group of analysts assigns meaningful odds to a rate hike in 2026. Their argument rests on three pillars: energy prices, geopolitical tail risks, and the possibility that inflation proves stickier than the SEP assumes. The U.S. Energy Information Administration projects that energy costs may stay elevated through 2028. If gasoline and heating oil remain high, headline inflation could run above the Fed’s 2.0 percent target for longer than officials expect. In that scenario, the committee might feel compelled to hike once or twice to prevent inflation expectations from drifting higher, even if it risks slowing growth.
A third, more dovish scenario envisions faster and deeper cuts if the labor market weakens more sharply than the SEP forecasts. This view gained traction after John Williams’ November 2025 comments on labor slack. Some economists now model a path where the unemployment rate rises to 4.7 or 4.8 percent by year-end 2026, prompting the Fed to cut three or four times to cushion the downside. Advocates of this scenario note that the 2026 SEP unemployment forecast of 4.4 percent is only a tenth higher than the current reading, leaving little room for deterioration before the Fed would need to respond.
Here are the five main scenarios currently circulating among professional forecasters:
Base case (1–2 cuts in 2026): Inflation moderates gradually, labor market stays stable, GDP growth near trend. Fed delivers small, infrequent cuts to keep policy slightly restrictive.
Hawkish case (one hike in 2026): Energy prices stay elevated, core inflation stalls above 2.5 percent, wage growth reaccelerates. Fed hikes once in Q3 or Q4 to anchor expectations.
Dovish case (3–4 cuts in 2026): Labor market cracks, unemployment rises above 4.7 percent, consumer spending slows. Fed front-loads cuts to prevent recession.
Geopolitical-driven case (volatile path): Renewed conflict or supply shocks cause inflation and growth to move in opposite directions. Fed oscillates between pause and cut, with high meeting-to-meeting uncertainty.
Consumer-impact case (focus on real rates): Real fed funds rate (nominal minus core PCE) stays positive but declines slowly as inflation falls faster than nominal cuts. Fed prioritizes real-rate stability over nominal-rate changes.
Political and Leadership Factors Affecting Fed Meeting Predictions
Federal Reserve Chair Jerome Powell’s term expires on May 15, 2026. The White House is expected to announce a nominee in early 2026. That timeline creates a window of uncertainty that can dampen the chair’s ability to build consensus and signal a clear forward path. Historically, lame-duck Fed chairs have been less willing to make bold policy moves, and dissenting votes often increase as committee members position themselves for influence under the next leader. The December 2025 meeting already saw sustained dissent. That pattern’s likely to persist through the chair transition.
Leadership uncertainty also affects forward guidance. The Summary of Economic Projections and year-end rate forecasts released at the final meetings of a chair’s tenure tend to carry less weight because markets know the next chair may shift priorities. If the incoming nominee signals a preference for lower rates or faster cuts, the current chair’s “hawkish cut” strategy (cutting rates while emphasizing the need for caution) loses credibility as a consensus-building tool. That dynamic can fragment the committee and make it harder to maintain a unified message.
The political dimension introduces additional noise. Chair succession debates in Congress often focus on Fed independence, inflation credibility, and the balance between employment and price stability. If the nominee faces a contentious confirmation process, markets may experience elevated volatility around Fed meeting predictions as investors try to handicap the policy stance of the next leadership team. The June 16–17 meeting will produce a fresh SEP and dot plot, but traders will also be listening for any hints about how the transition will unfold and whether the current committee is front-loading or deferring decisions to avoid boxing in the next chair.
Three key ways leadership uncertainty shifts predicted policy paths:
Reduced forward guidance credibility: Markets discount multi-year projections when they know a new chair will write the next SEP, making near-term meeting predictions more data-dependent and less anchored to the dot plot.
Higher dissent rates: Committee members use dissents to signal their views to the incoming chair and the broader policy community, fragmenting consensus and increasing meeting-to-meeting uncertainty.
Political pressure on independence: Succession debates often reignite questions about whether the Fed should prioritize inflation or employment, adding noise to market interpretation of policy signals and Fed speaker remarks.
Practical Strategies for Traders and Investors Using Fed Meeting Predictions

Monitoring CPI and PCE releases ahead of the June 16–17 meeting is the highest-priority action for anyone positioning around Fed predictions. The April and May inflation prints will land before the meeting. If either comes in significantly hotter or cooler than consensus, FedWatch probabilities can shift 20 or 30 percentage points in hours. Traders often set calendar alerts for 8:30 a.m. Eastern on CPI day, review the headline and core numbers within minutes, and adjust duration or sector exposure before the initial market reaction fades.
Using implied-rate curves from the FedWatch Tool or directly from /ZQ futures prices gives a more granular view than single-meeting probabilities. Plot the implied rate for each monthly contract out to December 2026, and look for inflection points where the curve steepens or flattens. A steepening curve suggests the market expects cuts later in the year. A flat or inverted curve signals expectations for a long pause or eventual tightening. When the curve shifts shape quickly, it often precedes a change in the consensus forecast, giving early movers a positioning edge.
Expected volatility spikes around FOMC meetings, especially when the decision is close to 50/50 or when an SEP is scheduled. Options markets price in elevated implied volatility for the two days surrounding the announcement. Strategies like straddles or strangles (where you buy both a call and a put at the same strike) can profit from large moves in either direction, regardless of the outcome. That approach works best when FedWatch shows uncertainty (probabilities near 50 percent for two different outcomes) and when the SEP or post-meeting press conference has the potential to surprise.
Sector positioning ahead of meetings should align with the most likely scenario and the potential for a surprise. If futures assign 80 percent odds to a pause but you believe there’s a 20 percent chance of a cut, consider a barbell approach: hold core exposure to defensive sectors (staples, utilities) that perform well in a pause, and add a smaller position in cyclicals or REITs that would rally on a cut. That way, you participate in the base case but still capture upside if the outcome differs.
Six tactical actions investors often consider around FOMC weeks:
Review and rebalance duration in fixed-income portfolios based on the latest implied-rate curve, extending if cuts are priced in or shortening if hike odds rise.
Set stop-loss or trailing-stop orders on rate-sensitive equity positions (REITs, utilities, leveraged growth) to limit downside if the meeting delivers a hawkish surprise.
Monitor credit spreads (investment-grade and high-yield) for early signs of stress. Widening spreads ahead of a meeting often signal that bond investors see recession risk even if equity markets remain calm.
Build or top up emergency cash reserves if you’re a consumer with variable-rate debt. A surprise hike can increase monthly payments on credit cards, HELOCs, and adjustable-rate mortgages within one billing cycle.
Compare at least three lenders before locking in any new loan or refinancing, and time applications to close after a predicted cut if FedWatch odds are high.
Use limit orders on volatile meeting days rather than market orders, especially in the first 30 minutes after the decision, when bid-ask spreads widen and price discovery can be erratic.
Key Things to Keep in Mind About Fed Meeting Predictions
The CME FedWatch Tool and all other market-implied probabilities reflect current pricing, not a commitment from the Federal Reserve or a guaranteed forecast of the future. Futures prices move continuously based on new data, Fed speaker remarks, geopolitical developments, and shifts in risk sentiment. A probability that stands at 80 percent today can fall to 40 percent after a single hot inflation print or hawkish comment from a voting member. That volatility is a feature, not a bug. It means the market’s processing information in real time.
Big data releases (especially CPI, PCE, and the monthly employment report) are the most common catalysts for probability reversals. In the two weeks leading up to a meeting, a strong jobs number or an unexpectedly high core inflation reading can flip consensus from cut to pause, or from pause to hike. The November 2025 probability swing (30 percent to 90 percent in two weeks after a single Fed speech) shows how quickly the market can reprice when new information changes the perceived risk balance.
Geopolitical events and energy shocks introduce tail risks that futures pricing struggles to capture. The March 2026 CPI spike was driven 75 percent by gasoline. A reminder that supply disruptions (whether from conflict, weather, or production cuts) can temporarily override the Fed’s preferred focus on core inflation. When headline and core inflation diverge sharply, the committee faces a communication challenge, and forward guidance becomes less reliable.
Four important reminders for interpreting predictions:
Probabilities aren’t certainties: An 80 percent chance of unchanged policy still leaves a 20 percent chance of a different outcome. Size positions accordingly and avoid over-leveraging on high-conviction bets.
SEP projections can and do change: The dot plot represents officials’ views at a single point in time, conditional on their baseline economic forecast. Those forecasts are updated quarterly and can shift materially.
Dissents signal internal debate: Sustained dissent over multiple meetings often precedes a policy pivot or a period of heightened uncertainty. Pay attention to who dissents and what alternative they advocate.
Leadership transitions add noise: The final months of a chair’s tenure are historically less predictive because the incoming chair may change priorities, forward guidance loses credibility, and committee cohesion weakens.
Final Words
Markets are heading into the June 16–17 meeting priced for a pause — Fed funds at 3.50%–3.75% and futures/CME FedWatch leaning toward unchanged.
This post showed how CPI/PCE, jobs and FedWatch odds reshape forecasts, plus the historical context, market scenarios, and tactical moves investors use to position ahead of the decision.
Use the numbers — 78.2% unchanged, 15.4% cut, 5.4% hike — to set positioning and watch the data. These fed meeting predictions tie the math to markets; stay focused and you’ll be ready no matter what — confident and prepared.
FAQ
Q: What is expected from the US Fed meeting?
A: The US Fed meeting is expected to keep the target range at 3.50%–3.75% at the June 16–17, 2026 meeting, with policymakers likely emphasizing data dependence and waiting for clearer inflation signals.
Q: What is the next Fed interest rate prediction?
A: The next Fed interest rate prediction is that policy will likely stay in the 3.50%–3.75% range; futures imply about a 3.64% effective rate (example: /ZQJ26 at 96.36 → 3.64%).
Q: Are the feds expected to drop rates, and will the Fed cut rates in October?
A: The feds are not widely expected to drop rates in October; markets price low near‑term cut odds — December probabilities show unchanged 78.2%, cut 15.4%, hike 5.4%.