

What if one scheduled date could wipe out a big gain or double it before your morning coffee?
Upcoming stock catalysts—earnings, Fed moves, CPI prints, FDA decisions, product launches, and options expiry—do exactly that.
They cram months of uncertainty into a single headline and force fast re-pricing.
This post gives a clear snapshot of the near-term dates to watch, explains why each event moves prices, and shows practical steps to size risk and act before the print.
No fluff — just the catalysts, the likely market reaction, and the key follow-ups traders and investors should mark on their calendars.
Immediate Snapshot of Near-Term Market-Moving Catalysts
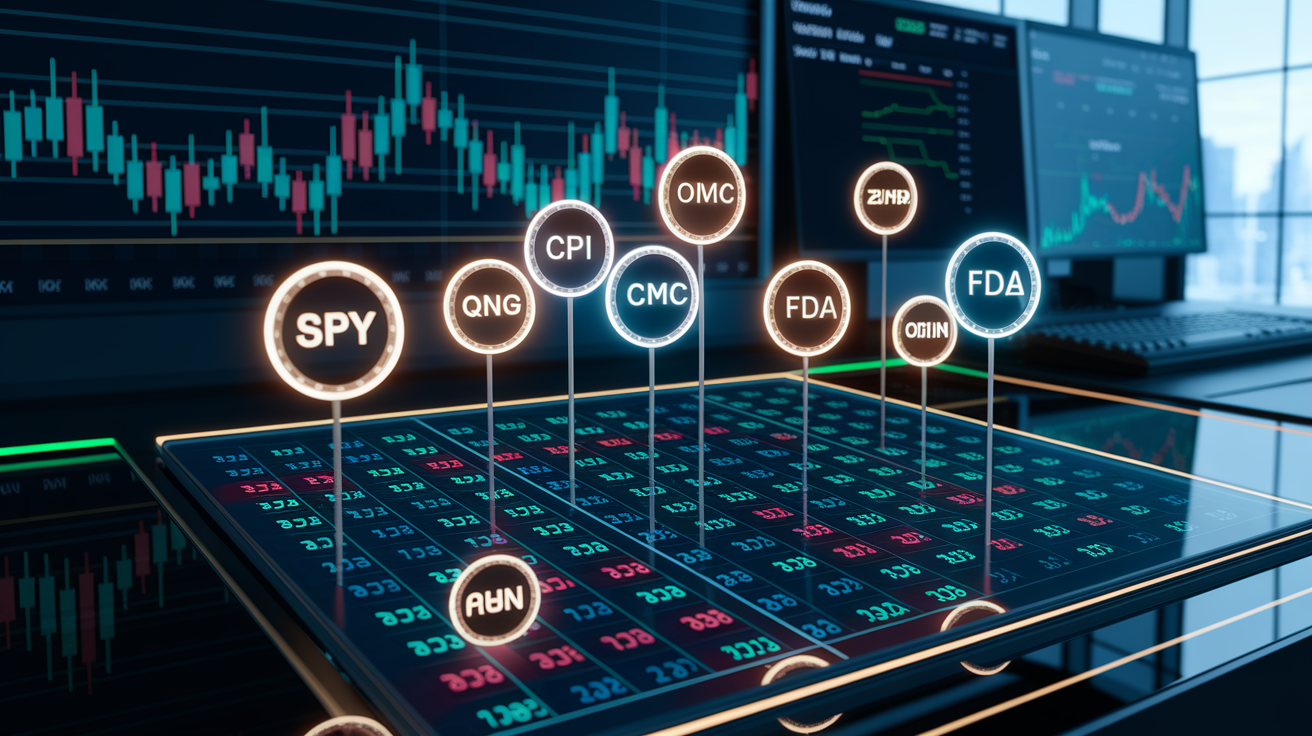
| Date | Ticker | Event Type | Details |
|---|---|---|---|
| Third Friday this month | SPY, QQQ | Monthly options expiration | Standard monthly expiry; potential for gamma-related moves |
| Next FOMC meeting | Broad market | Federal Reserve rate decision | Policy statement + press conference; watch for guidance changes |
| Next CPI release | Broad market | Consumer Price Index report | 8:30 a.m. ET print; sets expectations for Fed path |
| This week | AAPL, MSFT, GOOGL (examples) | Quarterly earnings reports | Guidance and revenue beats/misses drive immediate price action |
| Upcoming PDUFA date | Biotech (example: ALNY) | FDA approval decision | Binary outcome; approval or delay can trigger 30–50% moves |
| Late Q1 2026 | AI-related tech | Product launch event | New model/chip release; impacts demand forecasts |
| Mid-quarter | Pharma (example: VRTX) | Phase III readout | Top-line trial data; success advances pipeline valuation |
A stock catalyst is anything scheduled or unscheduled that rewrites market expectations for a company’s earnings, growth trajectory, or risk. These events matter because they condense months of debate into a single morning. One beat on guidance, an FDA approval, or a hawkish comment from the Fed can push a stock 10 percent before you finish your coffee.
Below, we’re breaking down the big types. Earnings. Regulatory calls. Product drops. Macro prints. Corporate moves. Market structure quirks. You’ll see which dates count, what causes the swings, and how to get ready before the headline drops.
Causes Behind Stock-Moving Catalysts and Why They Impact Price Action

When management tweaks earnings guidance, they’re rewriting the revenue and margin story that every analyst plugs into their model. A ten-cent raise on full-year EPS? Consensus climbs and buyers come back. A five-cent miss versus the whisper number? Algorithms sell first, questions later.
Regulatory dates deliver yes or no answers on opportunities worth billions. A PDUFA approval opens the door to commercial launch. A Complete Response Letter pushes revenue two years out and can cut the stock in half. M&A announcements shift who owns what, set off arbitrage trades, and usually come with a premium bid that gaps shares overnight.
Macro data, CPI, jobs, GDP revisions, they all change the discount rate the market applies to future cash flows. If inflation runs hot, the Fed looks more hawkish, rates tick up, and growth stocks get repriced lower. Each of these works on a different clock, but they all jam expected returns into instant price moves.
Four drivers you’ll see again and again:
- Revenue beats or misses against consensus, especially when guidance moves the same direction.
- Binary regulatory calls (approval, denial, delay) that open or shut entire revenue streams.
- Central bank surprises that reset the risk-free rate or shift liquidity bets.
- M&A bids that put a new floor under the stock and pull in arbitrage money.
Earnings-Driven Upcoming Stock Catalysts Traders Should Track

Quarterly earnings remain the most frequent, most traded type of catalyst. Companies report every 90 days, and each release tests three things at once. The backward number, the forward guidance, and the vibe management gives on the call. All three can point different directions, and you’ve got to figure out which one the market will follow.
Calendar-Based Earnings Tracking
Earnings calendars go live weeks ahead. Most large caps confirm the exact date by press release about two weeks out. Earnings season packs into the first three weeks after a quarter ends, so you get clusters of reports hitting the same morning or after the bell. Tracking a weekly calendar lets you map volatility windows, dodge surprise gaps in your holdings, and spot setups where a beat in one name might lift the whole sector.
What Drives Post-Earnings Moves (Beats, Misses, Guidance)
You can beat on EPS and still drop if guidance disappoints. A small revenue miss gets forgiven if management raises the full-year view. The market prices what’s ahead, so any shift to the forward path (raised revenue targets, wider margins, commentary on demand trends) weighs more than the historical quarter. Whisper numbers matter too. If the street’s at $1.10 but the whisper’s $1.15, a $1.12 print can still let people down.
Conference Calls and Sentiment Shifts
Tone matters. Executive turnover mentions. Customer concentration warnings. Product delay comments. All of it can override the headline numbers. A cautious CFO talking about macro conditions can kill the rally even after a beat. But a CEO highlighting accelerating bookings or early traction on a new product? That can keep the move going well past the first reaction.
| Example Catalyst | Description | Expected Impact |
|---|---|---|
| Revenue beat + guidance raise | Company tops sales estimate and lifts full-year forecast | Positive; analysts revise targets higher |
| EPS beat + guidance cut | Earnings per share beats, but management lowers outlook | Mixed to negative; forward path matters more |
| In-line result + positive call tone | Numbers match consensus; CEO highlights new contract wins | Modestly positive; keeps sentiment alive |
| Miss + reaffirmed guidance | Quarter falls short, but full-year targets stay put | Negative near term; stabilizes if guidance holds |
| Beat + margin compression warning | Revenue strong, but CFO flags rising input costs | Mixed; topline strength vs. profitability worry |
FDA Decisions and Clinical Readouts as High-Impact Upcoming Stock Catalysts

Regulatory decisions and trial readouts are binary. A Phase III win can double a biotech’s market cap overnight. A trial failure or regulatory delay can wipe out half the equity before the bell. PDUFA dates (Prescription Drug User Fee Act deadlines) get published months early and mark the FDA’s target decision day for new drug applications.
Advisory committee meetings often come before PDUFA dates and give you an early read. A positive panel vote raises approval odds. A split or negative vote can tank the stock even before the formal call. Phase II and Phase III readouts, especially top-line data drops, create sharp moves too because they tell you whether a drug advances to the next stage or enters the commercial pipeline.
Common FDA/Trial Catalyst Types
- PDUFA approval or Complete Response Letter on a specific date.
- Advisory committee vote and panel recommendation (days or weeks before the PDUFA).
- Top-line Phase III results announced by press release; full data shown at medical conferences.
- Phase II readout with dose response or early efficacy signals that guide the next decision.
- NDA or BLA submission acceptance, which starts the FDA review clock.
- Regulatory milestone payments or partnership news triggered by trial success.
A successful approval can push a small-cap biotech up over 100 percent, especially if it’s a single-asset story. Downside risk is just as steep. You need to size positions so you can survive a binary loss, track historical approval rates for the indication and trial design, and watch any FDA chatter (like requests for more data) that might shift the odds before decision day.
Product Launches, Commercial Rollouts, and Tech Release Timelines as Catalysts

Product launch dates signal forward revenue. When a company announces the release date for a new device, software platform, or consumer product, the market starts pricing expected demand, competitive spot, and margin assumptions. A delayed launch can flag supply chain trouble or weak pre-orders. An early launch or expanded rollout geography? That’s confidence in demand.
AI and hardware sectors publish launch calendars that move sentiment across the whole space. A new chip architecture with better performance per watt shifts data center spending forecasts and lifts the entire supply chain. Major contract wins, like a cloud platform signing a big enterprise customer or a biotech locking in a distribution partner, reset revenue paths and often trigger analyst upgrades.
Five launch drivers people watch:
- Official product release date and initial shipment or download numbers.
- Pre-order data or wait-list size shared ahead of launch.
- Partner news that validates commercial traction (retail chains, enterprise deals).
- Regulatory clearance for commercial sale in key markets (FDA 510(k), CE mark in Europe).
- Pricing and margin disclosure at launch events, which set profitability bets.
Macro, Fed, and Policy Dates as Market-Wide Upcoming Stock Catalysts
The Federal Reserve makes interest rate calls eight times a year at scheduled FOMC meetings. Each one includes a policy statement, updated economic projections (the “dot plot”), and a press conference. A single word swap, like going from “patient” to “data dependent,” can move the S&P 500 two percent in minutes.
CPI and inflation reports land monthly at 8:30 a.m. ET and immediately reprice rate bets. If core CPI runs hotter than forecast, the market pulls forward the next hike and reprices tech lower. If inflation cools, rate cut odds rise and growth stocks rally. Other macro prints like non-farm payrolls, GDP revisions, PMI surveys, they all shift the Fed’s next move and the discount rate applied to equities.
Monthly options expiration on the third Friday packs hedging flows into one session and can crank up intraday swings, especially when big positions expire in or out of the money. The market trades roughly 252 days a year after weekends and exchange holidays. Regular hours run 9:30 a.m. to 4:00 p.m. Eastern, with premarket and after hours offering thinner liquidity and wider spreads around macro prints.
Top macro events that swing stocks:
- FOMC rate decision and policy statement (eight meetings a year).
- Monthly CPI release, which resets inflation bets and Fed path pricing.
- Non-farm payrolls (first Friday most months), a key input for Fed employment mandates.
- Quarterly GDP revisions, which tweak growth assumptions and earnings forecasts across sectors.
Corporate Action and Filing Deadlines as Predictable Stock Catalysts

M&A announcements usually drop before the open or after the close, with an 8-K filing attached. The acquiring company’s stock typically sells off on deal news, while the target gaps up toward the offer price. Arbitrage spreads tighten as deal close probability climbs, and any regulatory or financing hiccup can widen the gap and spike volatility.
Stock buyback news signals management thinks shares are cheap and provides technical support by shrinking float. Dividend announcements or raises pull in income buyers and can lift the stock into the ex-dividend date. Secondary offerings and at-the-market equity programs boost share count and dilute existing holders, often triggering a sell-off even if the capital funds growth.
SEC filing deadlines create windows for material news. Annual 10-K reports must land within 60, 75, or 90 days of fiscal year end, depending on filer status (large accelerated, accelerated, or non-accelerated). Quarterly 10-Q filings are due within 40 or 45 days of quarter end. These windows let you anticipate when financial updates and risk factor changes show up, and any delay or early filing can hint at internal issues or confidence.
Five filing and action triggers worth tracking:
- 8-K filings for big events (M&A, executive changes, asset sales, debt restructurings).
- 10-K and 10-Q deadlines, which force disclosure of updated financials and risk factors.
- Form 4 insider transaction reports, showing director and officer buying or selling.
- Buyback authorization news and quarterly repurchase updates in earnings releases.
- Secondary offering or PIPE (private investment in public equity) announcements that dilute share count.
Trading Structure Catalysts: Options Expiry, Index Rebalances, and Liquidity Shifts

Options expiration dates concentrate gamma exposure and dealer hedging flows. Monthly expiry falls on the third Friday, and quarterly “triple witching” (when stock options, stock index options, and stock index futures all expire) can crank end-of-day volatility. Big open interest at specific strikes creates pinning, where the stock drifts toward the strike as market makers tweak delta hedges.
Unusual options activity, like block trades in out-of-the-money calls or spiking implied volatility ahead of an unscheduled event, can signal smart money positioning. Implied volatility itself acts as a catalyst. A sharp IV jump before earnings or a trial readout raises option premiums and can scare off new entries or force early exits by premium sellers.
Options-Related Catalysts
- Monthly expiration on the third Friday, with potential pinning near big open interest strikes.
- Quarterly triple witching, adding index futures settlement flows to equity options expiry.
- Elevated implied volatility ahead of known events, jacking up the cost of protective puts and long calls.
- Block trades or weird call/put volume flagged by options flow scanners, hinting at institutional moves.
Index & Fund Flow Catalysts
Index rebalances, additions to or deletions from the S&P 500, Nasdaq 100, or Russell indexes, force passive funds to buy or sell on a set date, creating known demand or supply. ETF reconstitutions at quarter end shift sector weights and can drive rotations. Fund rebalancing shows up when mutual funds or pension allocators tweak equity exposure to hit target weights, often creating end-of-month or end-of-quarter buying or selling that has nothing to do with fundamentals.
How Investors Can Use Systems to Monitor Upcoming Stock Catalysts

Catalyst monitoring systems pull earnings dates, FDA calendars, product launches, macro prints, and corporate actions into one feed. You filter by date, sector, event type, and suddenly you’re prioritizing high-probability setups instead of drowning in noise. Real-time updates catch last-minute changes, like a company bumping its earnings call up or a regulatory agency rescheduling a PDUFA review.
Event-driven strategies lean on accurate calendars to time entries before the catalyst and exits after the first reaction. Algorithmic detection scans SEC filings, newswires, and clinical trial registries to surface events that haven’t hit mainstream calendars yet. Portfolio tracker tools map upcoming catalysts across all your holdings, showing you when multiple positions face binary events in the same week.
Trader Checklist for Monitoring Catalysts
- Subscribe to weekly catalyst feeds that rank events by expected punch and give ticker level detail.
- Set calendar alerts for FOMC meetings, CPI releases, and monthly options expiration so volatility doesn’t catch you off guard.
- Filter earnings calendars by market cap and sector to zero in on liquid names with analyst coverage.
- Track PDUFA dates and clinical readout windows for biotech holdings, noting any FDA chatter that shifts timing.
- Monitor insider transaction filings and 8-K drops for early hints of corporate moves or management sentiment shifts.
- Use options flow scanners to spot unusual activity that might precede unannounced catalysts or takeover buzz.
Filtering surfaces catalysts days or weeks early, letting you pre-position or hedge. Risk control gets easier when you know exactly which holdings face binary events and can size positions to survive bad outcomes. Consistent monitoring turns catalyst awareness from a panicked scramble into an edge you can repeat.
Preventing Missed Opportunities: Building a Repeatable Catalyst-Tracking Routine

Weekly feeds like “Catalysts This Week” and “Weekly Top Catalysts” boil hundreds of possible events down to a short list you can actually use. Review it every Sunday night or Monday morning and no earnings report, FDA decision, or macro print sneaks up on you. Portfolio tracker tools overlay catalyst dates onto your current holdings, so you see at a glance which positions face near-term heat and which ones are in quiet periods.
Alerts tied to specific tickers or event types, like a notification when a biotech files an NDA or when the Fed publishes the dot plot, automate the whole thing. Drop recurring calendar entries for monthly CPI releases, quarterly earnings seasons, and options expiration Fridays and the routine builds itself into your trading week without manual lookups.
Five routines that stop missed catalysts:
- Review a curated weekly catalyst list every Monday to map the week’s big events.
- Set recurring calendar reminders for monthly macro prints (CPI, payrolls) and FOMC dates.
- Turn on ticker-specific alerts for earnings confirmations, PDUFA updates, and 8-K filings on watchlist names.
- Run a weekend portfolio scan to spot which holdings report earnings or face regulatory calls in the next two weeks.
- Subscribe to sector-focused catalyst feeds (biotech, tech, macro) to catch events outside your core holdings that might drive rotations.
When to Seek Additional Guidance or Tools for Catalyst-Driven Trading
When event volume swamps manual tracking, you need better tools. Pro-grade catalyst calendars offer API access, Excel exports, and real-time updates that hook into portfolio platforms or algo models. If you’re holding more than a handful of positions or trading across multiple sectors, a structured calendar with filtering and alerts saves you hours every week.
Educational stuff, guides on reading earnings reports, interpreting FDA decision letters, or scoring probability of approval, helps newer investors understand what actually drives post-catalyst moves. Case studies of historical reactions to similar events give you benchmarks for expected volatility and directional bias, cutting down guesswork when you size entries.
Three times to look for more help:
- Your portfolio spans ten or more tickers across biotech, tech, and macro-sensitive sectors, making manual calendar work impractical.
- You’re not comfortable interpreting trial endpoints, PDUFA review types, or SEC filing details that shift catalyst outcomes.
- You’re trading around high-frequency events (weekly options expiry, daily macro prints) and need automated alerts to keep your edge without gluing yourself to the screen.
Final Words
Markets are watching a packed stretch of earnings, FDA decisions, CPI prints and options expiry — real‑time catalysts that can swing prices fast.
This article put a quick 5–8 event mini‑calendar in front of you, then explained why catalysts move shares (beats/misses, binary regulatory outcomes, macro surprises) and walked through earnings, FDA readouts, product launches, filings, market‑structure events, monitoring tools and routines.
Use the calendars, filters and alerts to track upcoming stock catalysts and manage risk. Stay methodical, and volatility becomes opportunity.
FAQ
Q: Which stock has 1000x potential?
A: A stock with 1000x potential is extremely rare and impossible to guarantee. Investors look for tiny companies with disruptive products, huge addressable markets, strong execution, and patient capital—expect very high risk and long timelines.
Q: What is the 7% rule in stocks?
A: The 7% rule in stocks usually refers to using a 7% stop-loss or profit-taking threshold as a risk-management guideline; it’s a heuristic, not a universal rule, and depends on your strategy.
Q: Who owns 88% of the stock market in the USA?
A: Roughly the wealthiest households and institutions—mainly the top 10% of U.S. households—own about 80–90% of equities, per Fed wealth data; figures vary by source and year.
Q: How to find catalysts for stocks?
A: To find catalysts for stocks, scan earnings calendars, FDA/PDUFA dates, product launches, SEC filings, CPI/FOMC schedules, company IR pages, news alerts, and catalyst calendars or scanners; filter by sector and date.